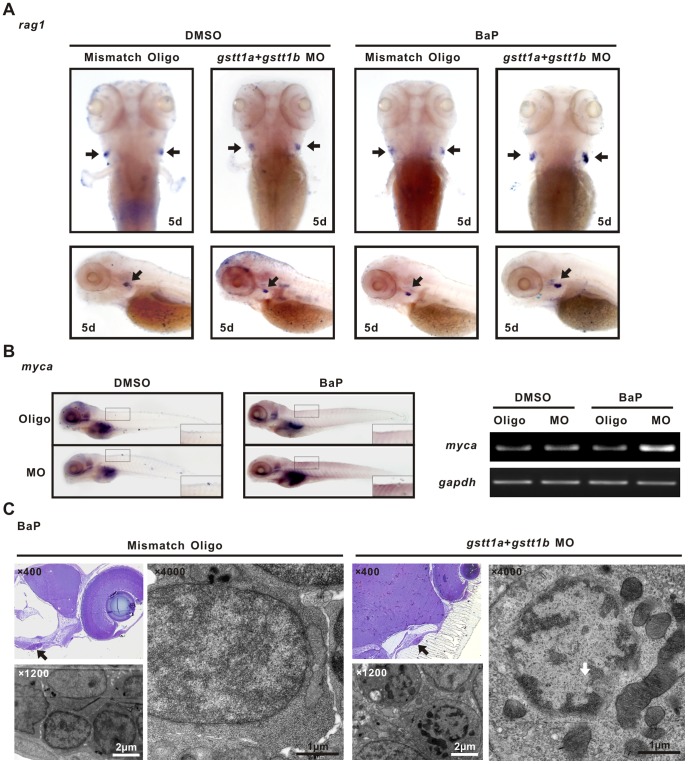
Figure 6. Knock-down of gstt1a and gstt1b promotes lymphocyte proliferation exposed to BaP.
A; WISH images showed the rag1 expression in the thymus (arrows) of differently treated 5 dpf embryos. B: In situ analysis of myca at 5 dpf. The morphants showed increased expression of myca in microinjected gstt1a and gstt1b morpholino exposed to BaP (Left panels), semi-quantitative PCR showed similar expression pattern in embyos (Right panels). C: Ultrastructure of thymic lymphocytes from 5 dpf larvae exposed to BaP. Images represent results from three independent experiments and each group contains 30 morphants.

