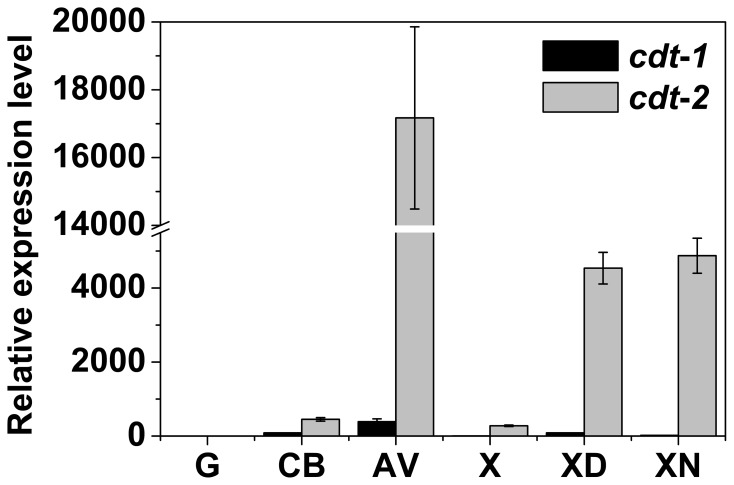
Figure 3. Gene expression level of cdt-1 and cdt-2 on different carbon sources.
Gene expression levels of cdt-1 and cdt-2 on different carbon sources (glucose, cellobiose, Avicel, xylose, xylodextrin and xylan) by qRT-PCR. The wild type strains were grown on different carbon sources at 25°C for 16 h (glucose, cellobiose, xylodextrin and xylan), 22 h (xylose), or 30 h (Avicel). Gene expression levels of actin (NCU04173) were used as an endogenous control in all samples. Each reaction was done in triplicate.

