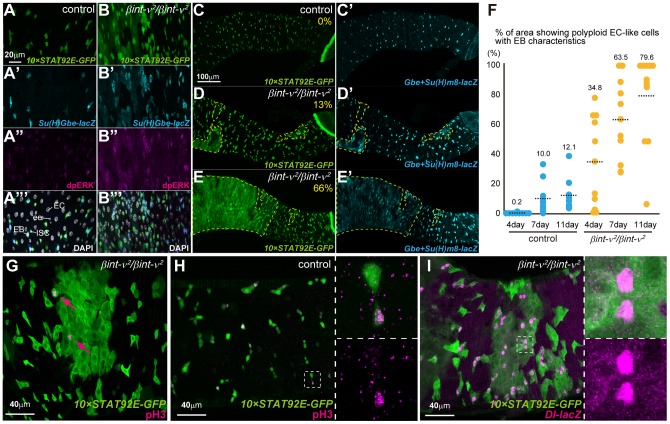
Figure 5. Misdifferentiated EC-like polyploid cells appear in young βint-ν mutants.
(A–B) The PMG epithelial cells of 7-day-old control (A) and βint-ν2 (B) flies, marked with 10×STAT92E-GFP (green), Su(H)Gbe-lacZ (cyan), anti-dpERK antibody (magenta), and DAPI staining (white). (C-E) Examples of the PMG of control (Su(H)Gbe-lacZ/+, 10×STAT92E-GFP/+) and βint-ν2 (Su(H)Gbe-lacZ/+, βint-ν2/βint-ν2, 10×STAT92E-GFP/+) flies showing 10×STAT92E-GFP (green) and Su(H)Gbe-lacZ (cyan). The broken lines and percentages respectively indicate the outline of the region showing misdifferentiated EC-like polyploid cells expressing 10×STAT92E-GFP+Su(H)Gbe-lacZ and the ratio of its area (measuring/calculation is detailed in the “Materials and methods” section). (F) Ratio of the abnormal epithelial area as indicated by broken lines in C–E for each of the control flies and βint-ν2 homozygotes at 4, 7, and 11 days old. Each blue and orange circle represents a datum derived from a single PMG. Dotted lines and values indicate averages. (G) The local midgut epithelium with a patch of the misdifferentiated EC-like cells marked by 10×STAT92E-GFP (green) in 7-day-old βint-ν2 flies (βint-ν2/βint-ν2, 10×STAT-GFP/+). In this region, pH3-positive ISC (magenta arrows) were predominantly contained. (H and I) The PMG of 7-day-old control (10×STAT-GFP/Dl05151) and βint-ν2 (βint-ν2/βint-ν2, 10×STAT-GFP/Dl05151) flies. The right panels are magnifications of the boxed areas in the left panels. Magenta staining in H and I represent pH3-positive and Dl-lacZ-positive cells, respectively.

