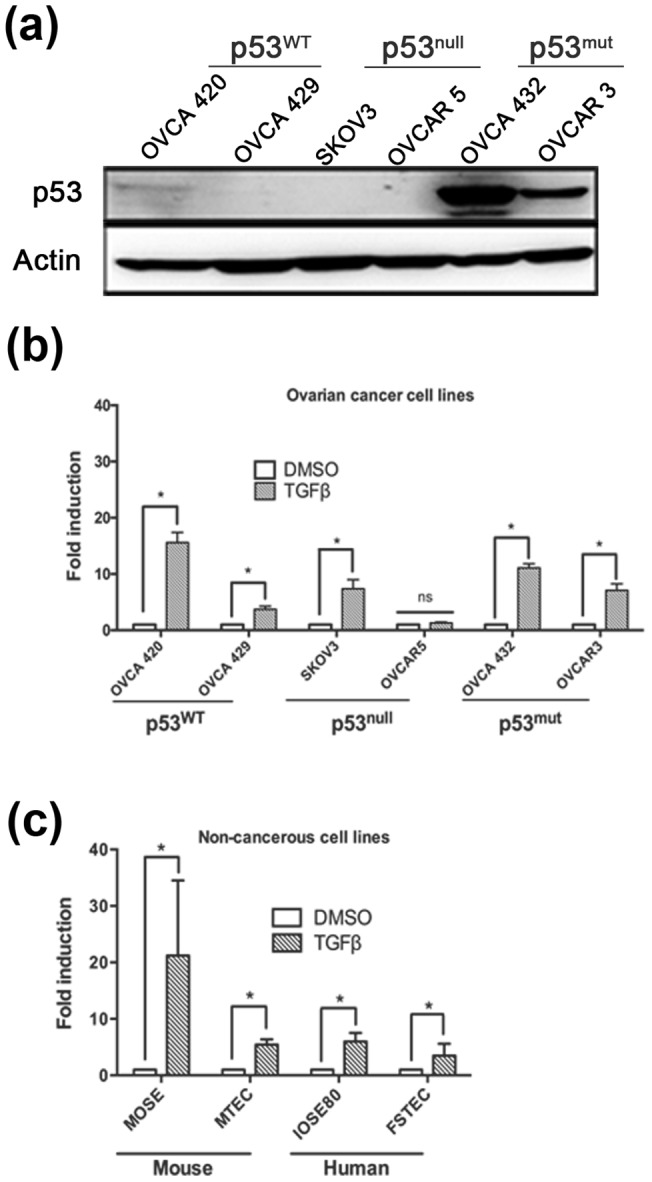
Figure 1. Ovarian cancer cell lines respond to TGFβ regardless of p53 status.

(a) Western blot analysis of ovarian cancer cell lines demonstrating their p53 status. Actin used as a loading control. (b) Six ovarian cancer cell lines (OVCA 420, 429, SKOV3, OVCAR 5, OVCA 432, and OVCAR 3), along with four primary, non-cancerous cell lines (MOSE, MTEC, IOSE80, and FTSEC) were treated with or without TGFβ (10 ng/mL) using the SBE-luc plasmid. ANOVA was performed separately for fold induction (TGFβ) and fold repression (inhibitor and TGFβ + inhibitor) to analyze significance compared to untreated. Data represented as mean ± SEM, *p≤0.05.
