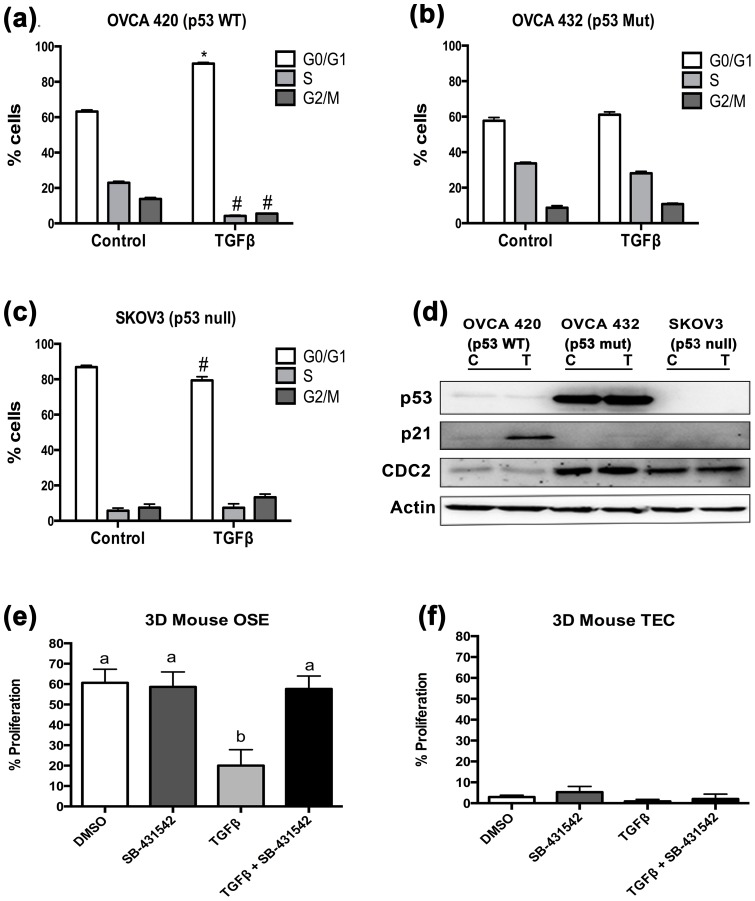
Figure 2. p53 wild-type ovarian cancer cell lines undergo cell cycle arrest in response to TGFβ.
(a–c) OVCA 420, OVCA 432, and SKOV3 cell lines were treated with 20 ng/mL TGFβ for 24 hours and subjected to flow cytometry analysis. Distributions of cells in the three phases of the cell cycle are represented by mean percentages +/− SEM. Statistical significance represents a difference between number of cells in each cycle between treated and untreated and represented with * for an increase of treated cells compared to untreated; #represents decrease of treated cells compared to untreated; p≤0.05 (d) Western blot analysis of the three ovarian cancer cell lines probed for cell cycle proteins p21 and CDC2. Actin was used as a loading control. (e–f) Proliferation assay performed using BrdU incorporation in 3D organ culture of mouse ovaries and tubes. One-way ANOVA was performed. Data represented as mean ± SEM *p≤0.05.

