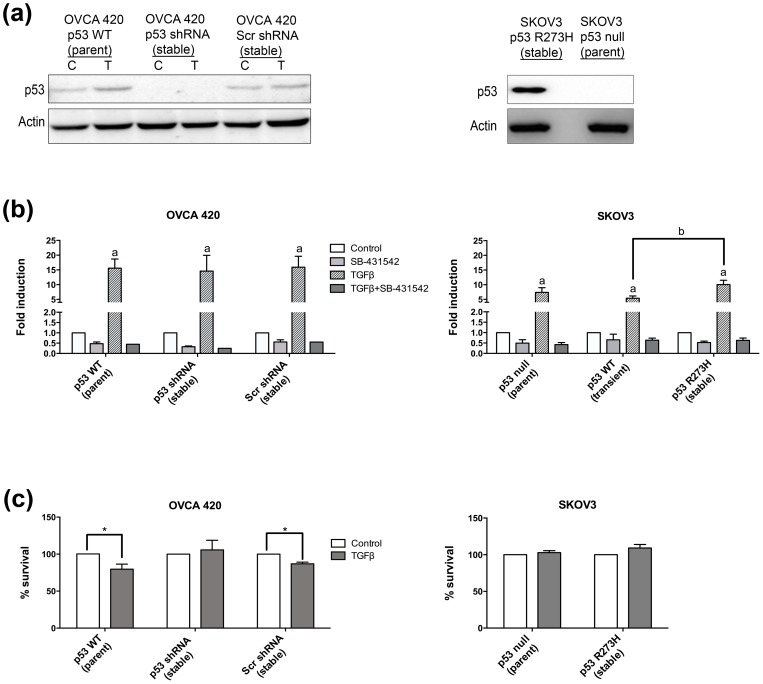
Figure 3. Wild-type p53 cells, but not p53 null or mutant p53 cells, are growth inhibited by TGFβ.
(a) Western blot analysis of stable cell lines to knockdown of p53 by shRNA plasmid or expression of mutant p53 R273H. C = control, T = TGFβ treated. (b) SB-431542 (5 μM) was used to inhibit TGFβ signaling. For each panel, data represents mean ± SEM p≤0.05 increase over untreated for groups labeled with a, or between treated groups labeled with b. (c) Cell survival. Percentage of TGFβ-treated cell survival compared to untreated. Data represent mean ± SEM, *p≤0.05.

