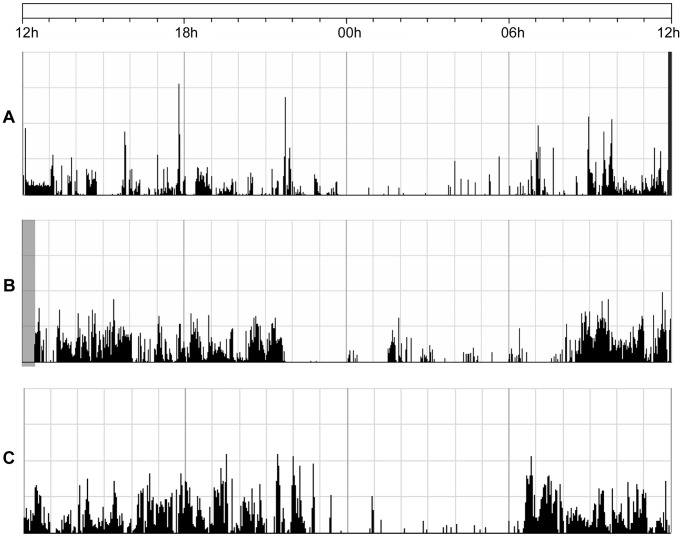
Figure 1. 24-hour actigraphy recordings for all three groups.
Activity counts from a patient with depression (A), a patient with mania (B) and a healthy control (C). The figure shows the activity counts in black during 24 hours from 12 h to 12 h the next day. The dark gray area at the end of recording A and the gray area at the beginning of recording B represent excluded periods, when the subject was not wearing the actigraph.

