Figure 1.
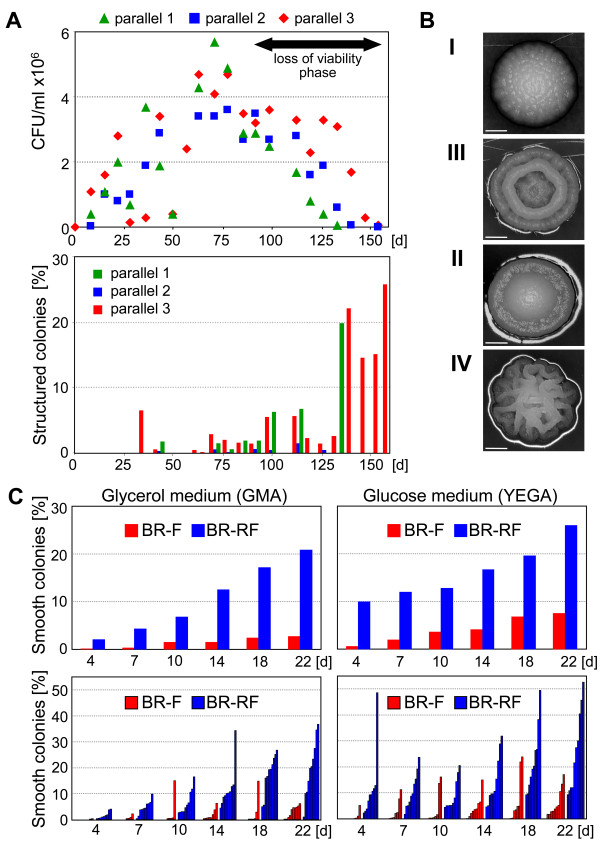
Origin and stability of the BR-RF strain. A. Upper panel, growth curve of 3 parallel static cultures of the BR-S strain in MM-2% ethanol medium, expressed as CFU/ml. Lower panel, appearance of cells forming structured colonies (switched phenotype) expressed as a percentage of total colony number. A representative experiment of the three is shown. B. Colonies with structured morphology originating from the BR-S strain during cultivation in static culture. From the top, morphotypes I, II, III and IV (the latter named BR-RF). Scale bar = 1 mm. C. Domestication frequency of colonies of the BR-F and BR-RF strains. The upper graphs represent the average appearance of smooth colonies after the re-plating of BR-F (red columns) and BR-RF (blue columns) colonies relative to the total CFU of all re-plated colonies. The bottom graphs show the switching frequencies of individual colonies, BR-F (red columns) and BR-RF (blue columns).

