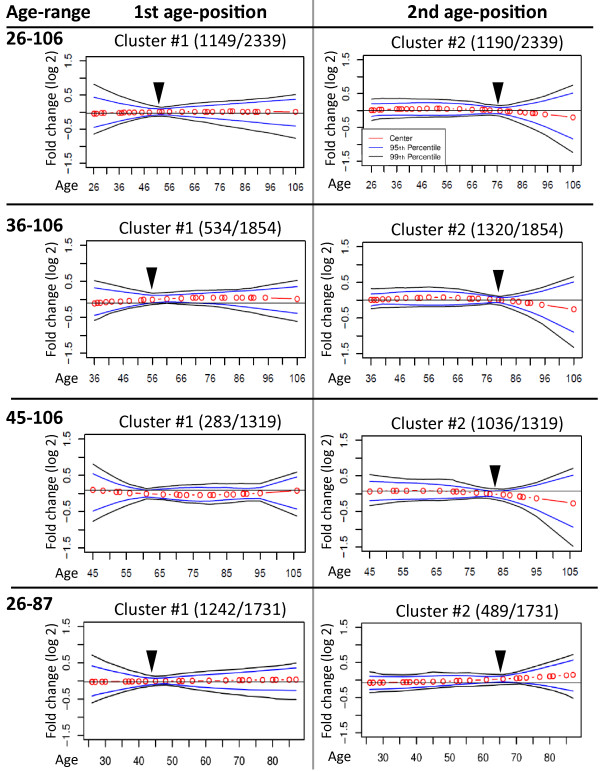
Figure 2.
The effect of the dataset age-range on age-positions. Plots show the expression trends of the significant probes clustered using k-means with absolute correlation as metric in the brain cortex dataset. Trends were generated for the age-ranges: 26–106 (original); 36–106; 45–106 and 26–87. Red circles interconnected by red lines represent the cluster centroids, blue and black lines are the 95th or 99th percentiles, respectively. The number of probes in each cluster is indicated between brackets. Arrowheads denote the age-positions, indicating a bend in the expression trend.

