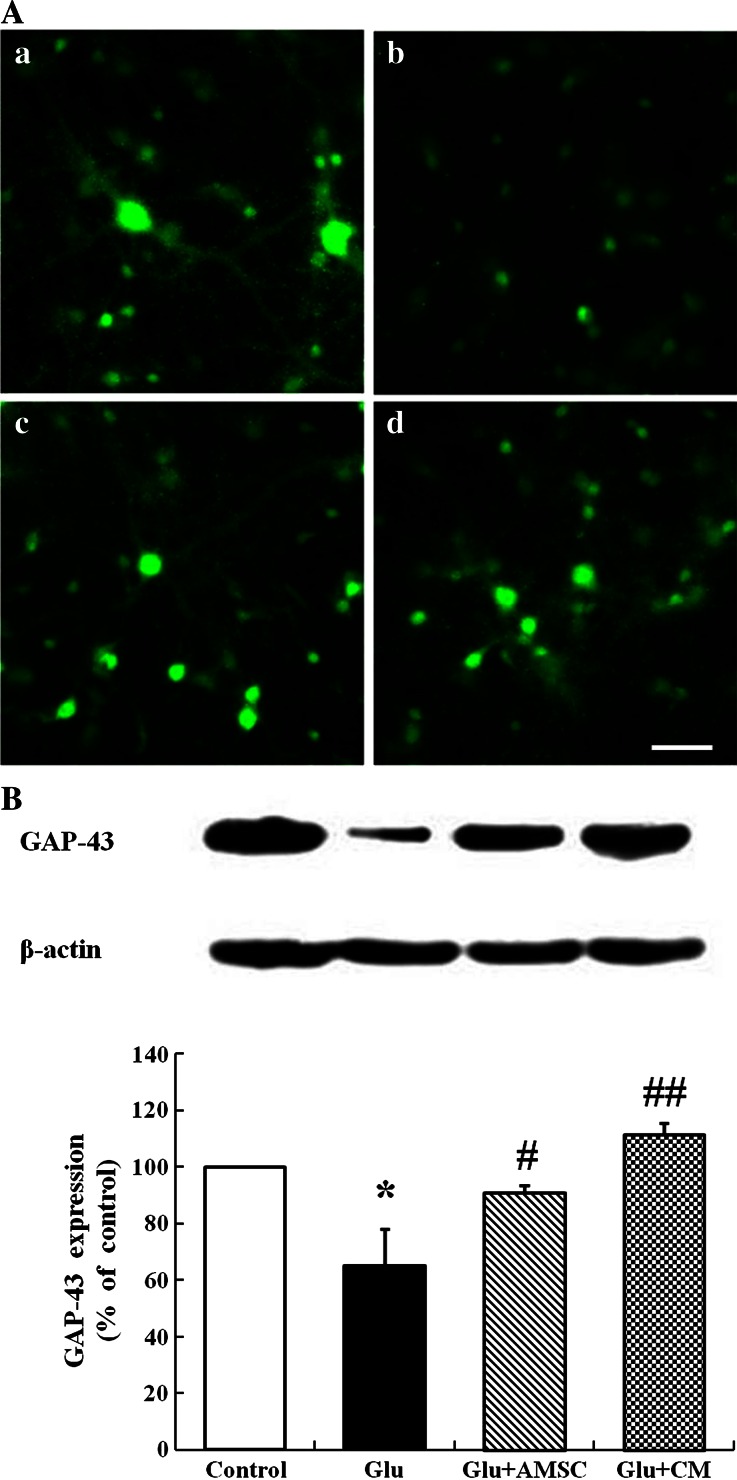
Fig. 3.
AMSCs restored GAP-43 expression and distribution in cortical neurons. After exposure to glutamate for 15 min, GAP-43 expression and distribution in neurons were measured by immunofluorescence labeling and Western blot. a Representative photomicrographs of GAP-43 (a) control group; (b) glutamate treated group; (c) AMSCs co-culture group; (d) AMSC-CM group. b GAP-43 levels were analyzed using Western blot. Protein loading was checked by stripping and re-probing the membrane with anti-actin antibody. Data are presented as mean±SD. * P < 0.05 versus control group, # P < 0.05, ## P < 0.01 versus glutamate treated group. One-Way ANOVA. Scar bar 200 μm

