
Figure 4.
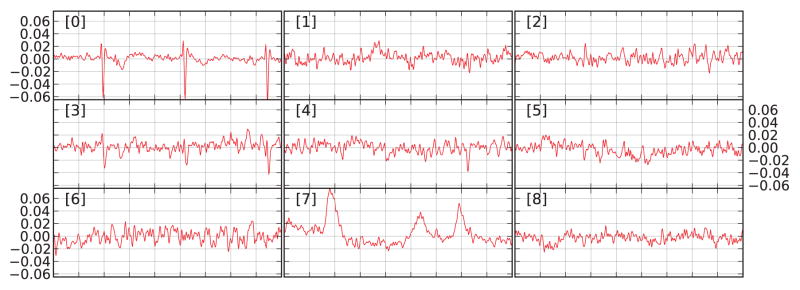
Trellis plot of 9 ICA components. The sources 0 to 5 are reorderd by bivariate Pearson correlation with the ECG channel. The first time series (index 0) displayed in the upper-left window clearly resembles a cardiac signal. The time series 7 closely matches the EOG signal.