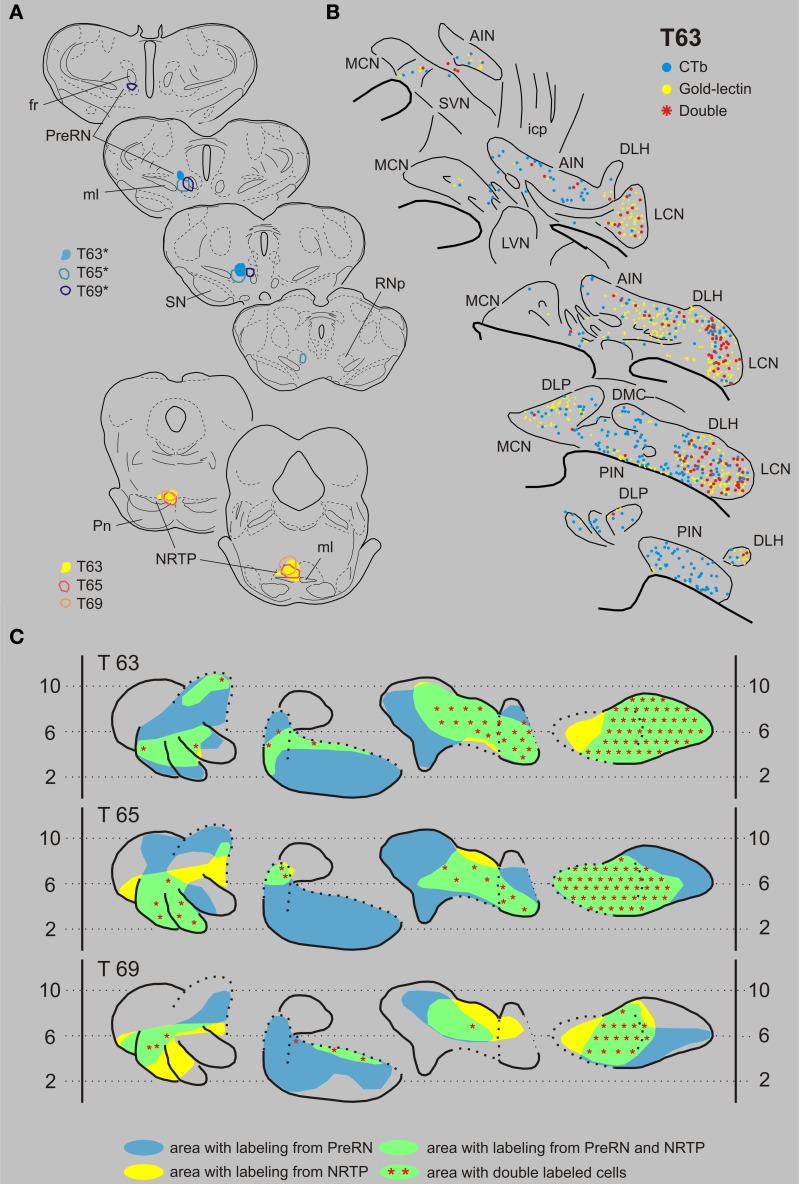
Figure 7.
Diagrams depicting results of the combination NRTP and the PreRN. (A) Injection sites of all three analyzed cases. Upper left hand panels show the injection sites within transverse diagrams of the mesodiencephalon. Bottom panels show the related injections sites in the NRTP. CTb injections (case number indicated with*) were made in the PreRN of all three cases. (B) Plots of 5 equidistant (320 micron) sections showing labeled neurons within the contralateral CN of case T63. (C) Overview of the distribution of retrogradely labeled neurons of case T63 and of the two additional cases (T65 and T69) in standardized diagrams of the CN. Areas containing labeled neurons from the PreRN and NRTP are indicated in blue and yellow, respectively. Note that all overlapping areas (green) contain double labeled neurons (red symbols). Conventions and abbreviations as in Figures 3–5.

