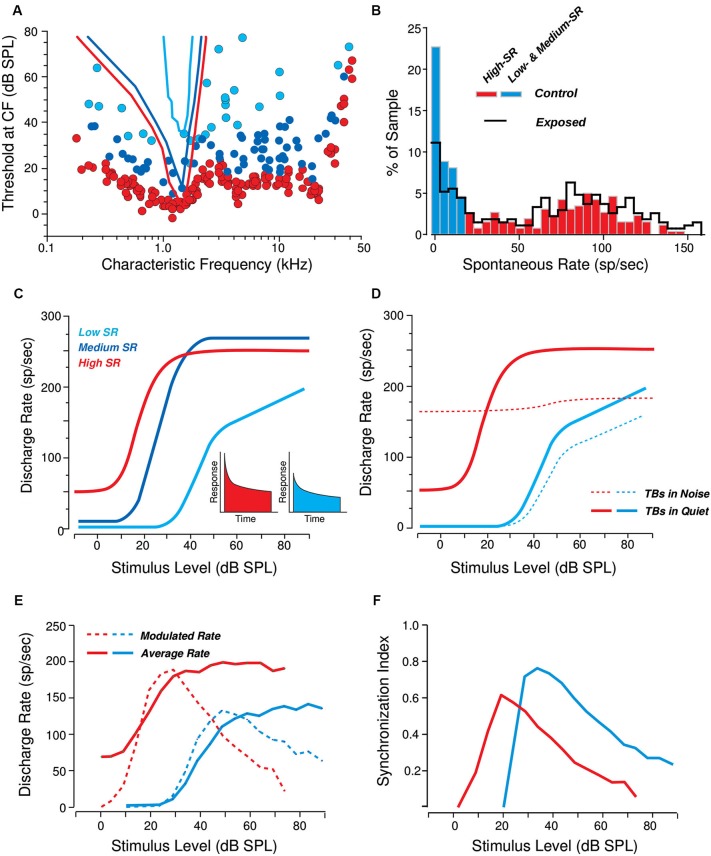
Figure 2.
Response differences among cochlear nerve fibers of the three SR groups. (A) Threshold tuning curves of example high- medium- and low-SR fibers (see key in C) are superimposed on a scatterplot of thresholds at the characteristic frequency (CF) for all the fibers sampled from one animal. Data from cat (Liberman, 1978). (B) Distribution of spontaneous rates in large samples of cochlear nerve fibers before (red and blue bars) vs. after (black line) a noise exposure causing a reversible elevation of thresholds. Data from guinea pig (Furman et al., 2013). (C, D) Schematic rate-vs-level functions for high-, medium-, and low-SR fibers to tone bursts (TBs) at the CF, in quiet (C) and in continuous background noise at a fixed 0 dB spectrum level (D). Data from cat (Liberman, 1978; Costalupes et al., 1984). The insets in panel C show schematic peri-stimulus time histograms of the response to a moderate-level tone burst: onset rates are higher in the high-SR fiber than in the low-SR fiber. (E, F) Responses to SAM tones in high- vs. low-SR fibers expressed as average rate and modulated rate (E) or average synchrony (F; see text for definitions). Responses are to carrier tones at the CF, amplitude modulated (AM) at 100 Hz. Data from cat (Joris and Yin, 1992).

