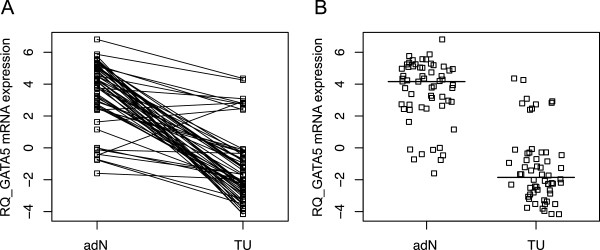
Figure 1.

GATA5 mRNA expression in paired clear cell renal cell carcinoma and adjacent normal tissues. A) Comparison of the relative GATA5 expression (RQ) values in adjacent normal (adN) and tumor (TU) tissues from ccRCC patients (p < 0.001). B) Scatterplot analysis illustrating the distribution of relative expression values (RQ) observed for TU and adN in ccRCC specimens. Bold lines indicate the median of relative expression values.
