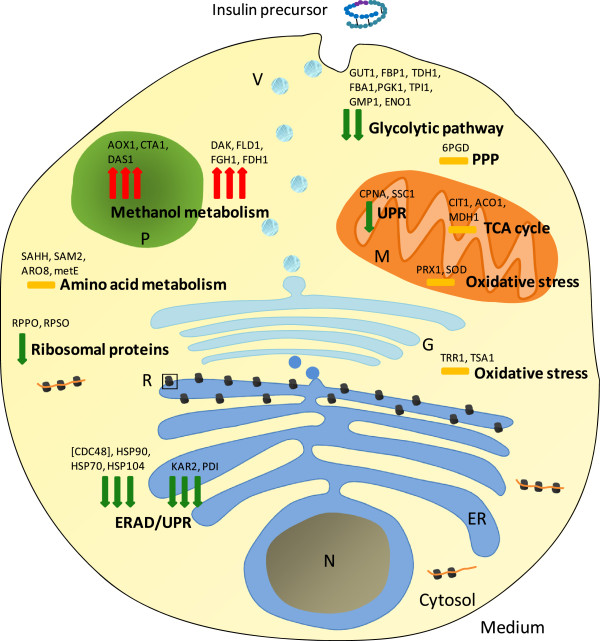
Figure 1.
Global view on the intracellular proteome profile change in P. pastoris X-33 during secretory insulin precursor production (after shift from glycerol batch to methanol fed-batch). The red arrows (↑) indicate an increasing and the green arrows (↓) a decreasing amount of functional proteins in the methanol fed-batch phase. An orange dash (−) indicates no significant change. One arrow indicates small (log2 change 0.6-1), two arrows strong (log2 change 1–4) and three arrows very strong changes (log2 change > 4). The arrows correspond to the average of log2 fold changes of proteins from each functional group. The position of the arrows is according to the proteins location in the cell. Only the most prominent proteins from each functional group are indicated. The complete list of all identified proteins and the corresponding values of log2 changes are given in the Additional file 1: Tables S1 and S2, respectively. Abbreviations: TCA, tricarboxylic acid cycle; PPP, pentose phosphate pathway; ERAD, endoplasmic reticulum associated degradation; UPR, unfolded protein response; P, peroxisome; R, ribosome; ER, endoplasmic reticulum; V, vesicle; M, mitochondria; N, nucleus; G, Golgi complex. Protein/gene abbreviations are given in the Additional file 1: Table S1.

