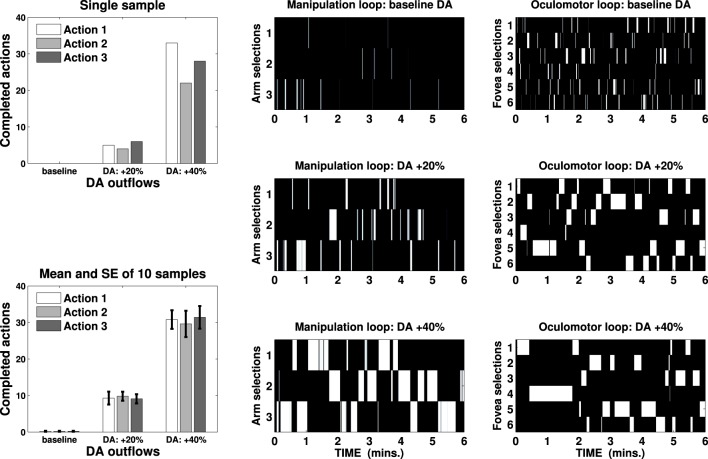
Figure 5.
Bin charts show completed actions in a single sample test (top) and mean and standard error of ten sample tests (bottom) in three DA conditions (baseline, +20% and +40%). B/W colormaps represent the neural activity of the external cortical layers of two striatocortical loops that have resulted in the action represented in the first bin chart. One loop has been used for the manipulation (three channels, center) and the other for the attentional control (six channels, right): an action is considered terminated if both the loops maintain their selection for 2 s.

