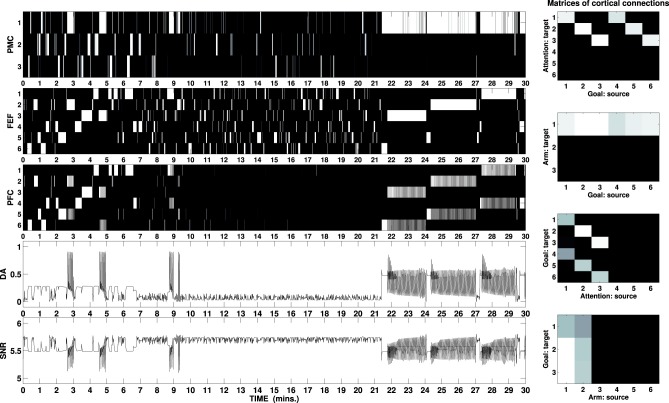
Figure 6.
B/W colormap represents the neural activity recorded in the external cortical layers of the three-looped neural model, labeled as PMC, FEF, and PFC (to download graphs showing the neural activity of all layers, see the Supplementary Material). The two line charts respectively represent the activity of the unit responsible for the simulated DA release and the sum of the activity in the SNr as part of the ventral loop. The graphs at the right represent B/W colormaps of the matrices of the cortico-cortical weights acquired during the task in the same simulation (see Supplementary Material for a video of the robot).

