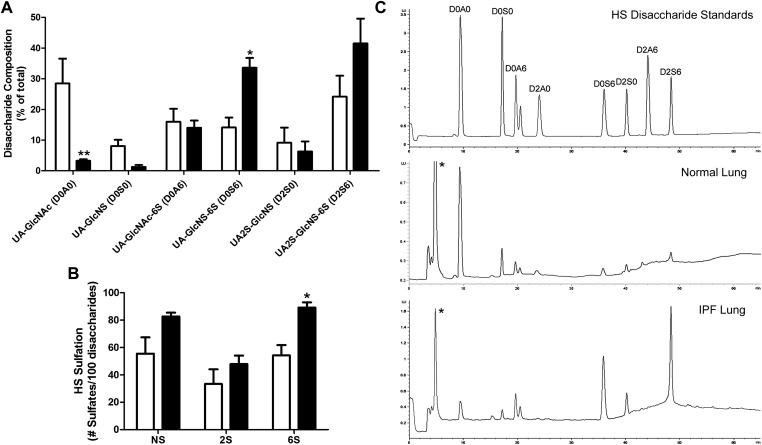
Figure 1.
Heparan sulfate (HS) disaccharide expression profiles of normal and idiopathic pulmonary fibrosis (IPF) lungs. (A) HS disaccharide composition (% of total) of normal (white bars) and IPF (black bars) lungs. (B) HS sulfation (number of N-sulfates [NS], 2-O-sulfates [2S], and 6-O-sulfates [6S] per 100 disaccharides) of normal (white bars) and IPF (black bars) lungs. *P < 0.05; **P < 0.01. (C) Representative chromatographs of HS disaccharide standards and HS disaccharides from normal and IPF lungs. *Unidentified peak, possibly HS monosaccharides. x Axis, elution time in minutes; y axis, fluorescent intensity, which corresponds to the quantity of each disaccharide.

