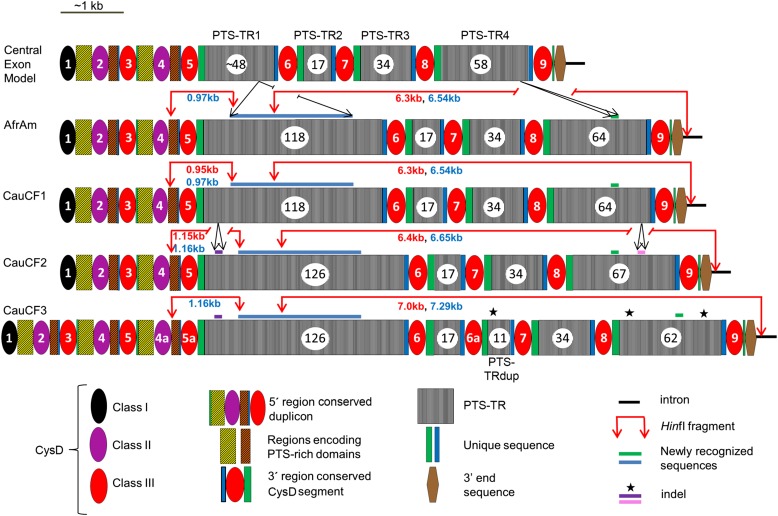
Figure 3.
Genetic variants and organization of the MUC5AC central exon. Sequence schematics representing the MUC5AC central exon from the AfrAm subject and three white subjects with cystic fibrosis produced by de novo assembly were compared, as a group and individually, with the central exon model (22), and the results are shown. All four subjects in this study have larger PTS-TR1 (extra 1.9 kb, blue bar) and PTS-TR4 (extra 216 bp, green bar) regions than the draft genome model sequence (Figure 1B). The increase in the PTS-TR lengths, when compared with the previously known model, more specifically shown in the central exon model of this figure, effectively link the previously available genomic fragments (Figure 1) into one unit and complete the central exon sequence. Indels are shown as purple bars, pink bars, or black stars. The three classes of CysD domains are shown (colored ovals). The duplication of the CysD domains in CauCF3, as compared with other subjects, is indicated by CysD4a, CysD5a, and CysD6a. HinfI sites are shown by red arrows, and the small and large HinfI fragment lengths identified by Southern blots are shown in red text, which are very similar to the in silico sizes (blue text).

