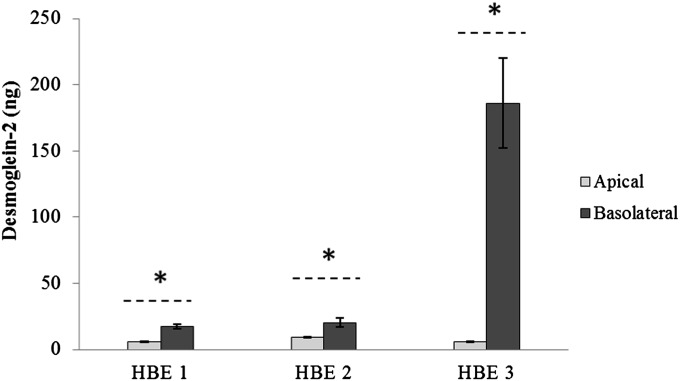
Figure 5.
Expression of Desmoglein-2 in HBE secretions. Average protein concentration (± SEM) for each HBE cell culture was measured using ELISA. Statistical differences between amount of Desmoglein-2 in apical and basolateral secretions for each cell culture were based on Wilcoxon signed-rank test. *P < 0.05.

