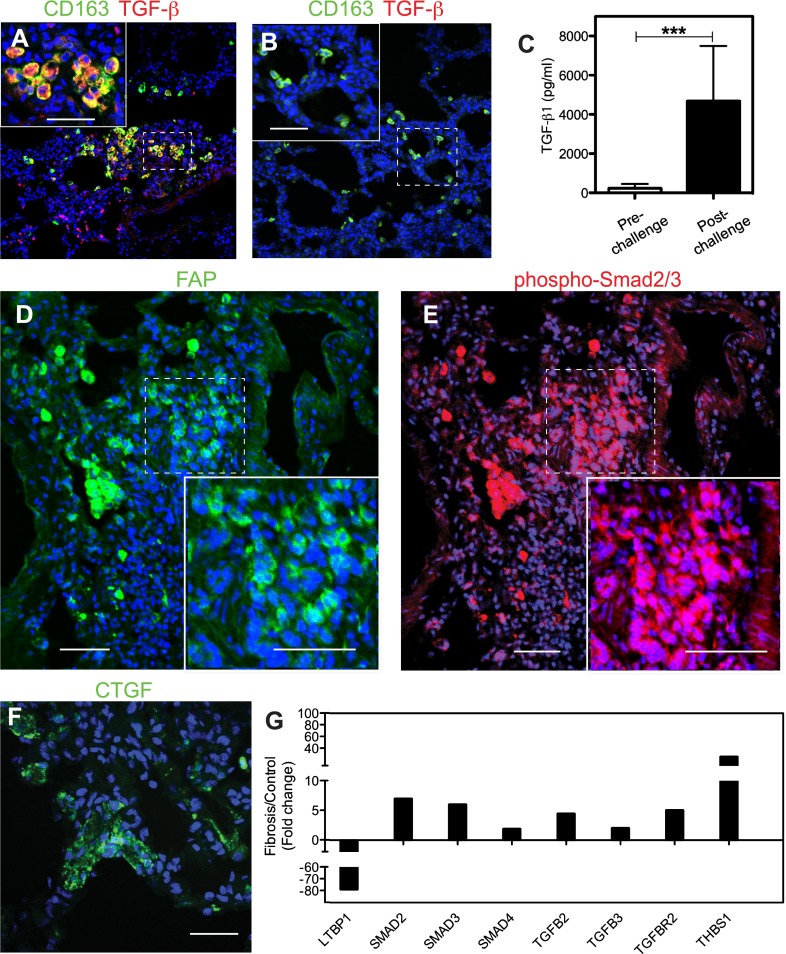
Figure 7.
Expression of transforming growth factor (TGF)-β signaling proteins in the lung of long-term sepsis–surviving baboons. (A and B) Staining for M2 macrophage marker CD163 (green) and TGF-β (red) in the lung of a baboon killed at 6.5 months after challenge (A) shows marked increased accumulation of cells that costain for TGF-β and CD163 (yellow; presumably M2 macrophages) in the challenged baboons (A) versus unchallenged control animals (B). Insets show higher magnification of the areas marked with dashed borders. Colocalization of the two antigens is shown in yellow and nuclei in blue. (C) Biochemical analysis shows significantly increased TGF-β1 in the plasma of animals that survived E. coli sepsis for longer than 6 months as compared with their prechallenge levels. Data are presented as mean ± SEM; 2-tailed Student t test; ***P < 0.001; n = 6 animals. (D and E) Staining for FAP (green; D) and phospho-Smad2/3 (red; E) demonstrates profibrotic TGF-β signaling in activated fibroblasts. Nuclei are shown in blue. Insets show higher magnification of the areas marked with dashed borders to highlight the nuclear staining pattern of phospho-Smad 2/3 (red and blue overlay appears purple). (F) Immunostaining for connective tissue growth factor (CTGF; green) within the alveolar walls of the lung from a sepsis survivor killed after 6 months after challenge. Lung samples from healthy control animals did not stain for FAP, phospho-Smad, or CTGF (not shown). (G) Quantitative RT-PCR analysis shows increased mRNA expression of TGF-β signaling–positive regulators (SMADs 2, 3, and 4, TGF-β, and TGF-β receptor) and thrombospondin 1 (THBS1) transcripts, and down-regulation of the negative regulator, latent TGF-binding protein 1 (LTBP1), in the septic animals killed over 6 months after challenge (fibrosis group) as compared with healthy control animals. Data are shown as average fold change (n = 6 animals for fibrosis and n = 3 animals for control groups). Scale bars, 200 μm (A, B, D, and E), 100 μm (F).

