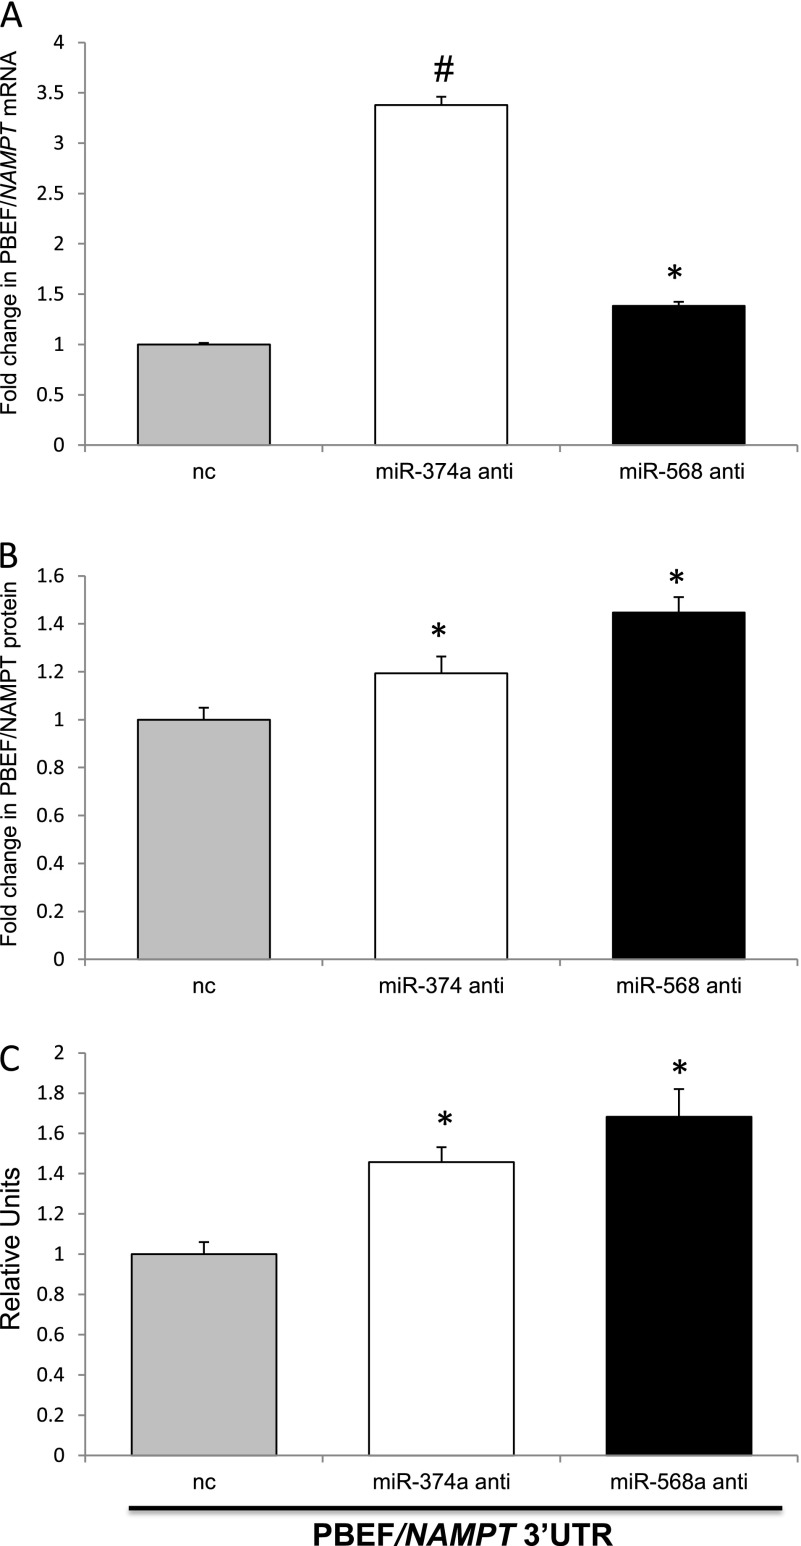
Figure 7.
Effects of miRNA antagomirs on inflammatory agonist–induced PBEF/NAMPT expression and 3′-UTR reporter activity. Total RNA was isolated from ECs and transfected with nc or with the indicated miRNA. Anti- and PBEF/NAMPT mRNA levels were detected via real-time PCR (A). Data are presented as fold change in mRNA level over control and expressed as means ± SE from four independent experiments. *Significantly different from control cells (P < 0.05). #Significantly different from control cells (P < 0.01). ECs transfected with nc or with the indicated miRNA anti- and endogenous PBEF/NAMPT protein were detected via immunoblot. The bar graph represents relative densitometry (B). Data are presented as fold changes in endogenous PBEF/NAMPT over nc pretreatment and expressed as means ± SE from three independent experiments. *P < 0.05 versus control. ECs were cotransfected with the PBEF/NAMPT 3′-UTR reporter together with phRL-TK, nc, or with the indicated miRNA (C), and luciferase activity was measured according the manufacturer’s protocol. Data are presented as relative luciferase units over control and expressed as means ± SE from four independent experiments. *Significantly different from control cells (P < 0.05).

