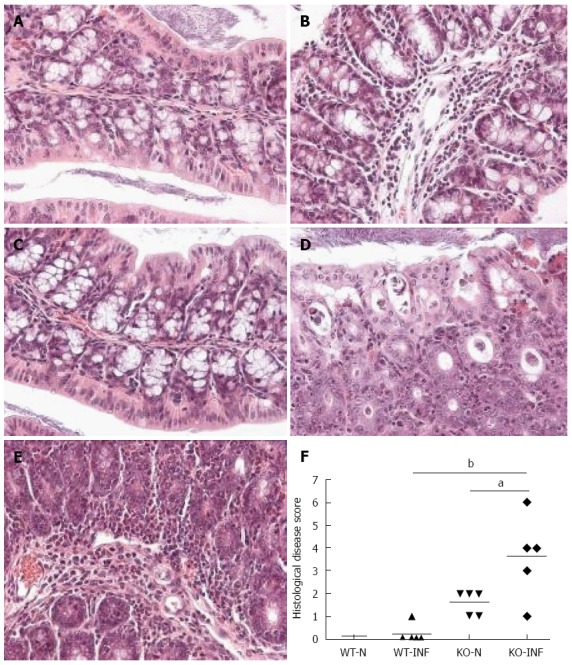
Figure 5.

Histological analysis of proximal colon from FVB (WT) and mdr1a-/- (PGP-KO) mice. A-E: H and E stained sections from proximal colon of WT-N (A), WT-INF (B), KO-N (C) and KO-INF (D-E). Tissues were isolated on day 19 post-infection in Trichuris muris (T. muris) infected mice; F: Histological disease scores for colon from naïve (WT-N; KO-N) and T. muris infected (WT-INF; KO-INF) mice based on the grading system described by Collett et al[11], 2008. Bar shows mean values for each group aP < 0.05, bP < 0.01, n = 5 for each group.
