
Figure 6.
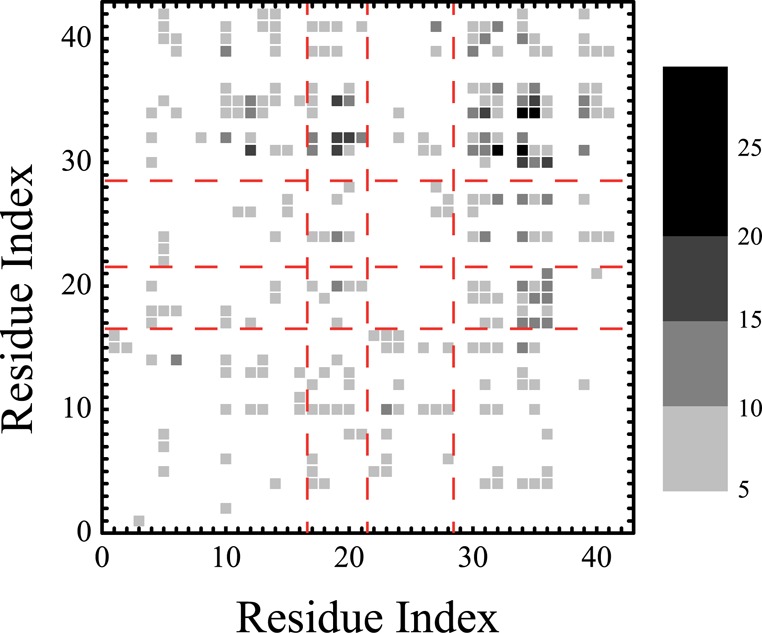
Interpeptide side chain–side chain contact maps. The color scale defines the contact probability. The red dashed lines define the four Aβ regions: NT, CHC, FL, and CT.
Official websites use .gov
A
.gov website belongs to an official
government organization in the United States.
Secure .gov websites use HTTPS
A lock (
) or https:// means you've safely
connected to the .gov website. Share sensitive
information only on official, secure websites.
Interpeptide side chain–side chain contact maps. The color scale defines the contact probability. The red dashed lines define the four Aβ regions: NT, CHC, FL, and CT.