
Figure 7.
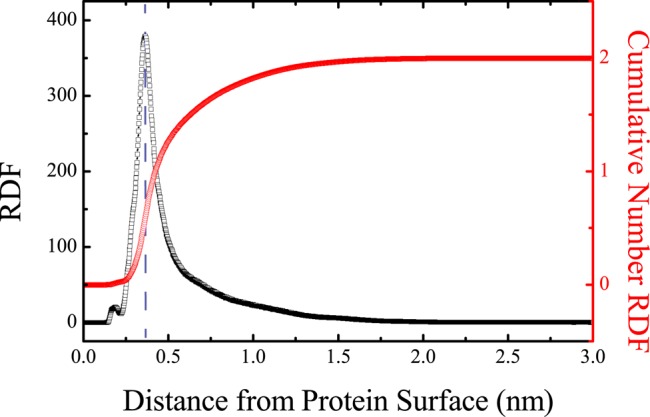
Radial distribution functions of NQTrp from Aβ dimer. The RDF is shown with black squares. The cumulative number RDF is shown with red circles. The vertical blue dashed line labels the position of the highest peak in the RDF curve.
Official websites use .gov
A
.gov website belongs to an official
government organization in the United States.
Secure .gov websites use HTTPS
A lock (
) or https:// means you've safely
connected to the .gov website. Share sensitive
information only on official, secure websites.
Radial distribution functions of NQTrp from Aβ dimer. The RDF is shown with black squares. The cumulative number RDF is shown with red circles. The vertical blue dashed line labels the position of the highest peak in the RDF curve.