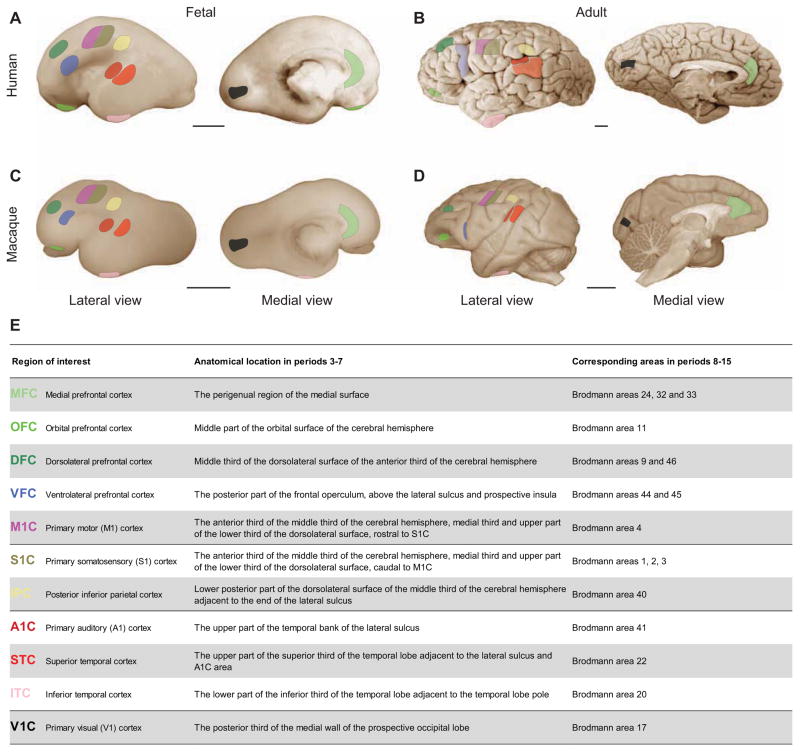
Figure 1. Topographic locations of NCX samples in the fetal and adult human and macaque brains.
(A–E) Schematic shows anatomical positions of dissections of NCX samples in (A) prenatal and (B) postnatal human, and (C) prenatal and (D) postnatal macaque brains, and their corresponding Brodmann areas in the postnatal NCX (E). Each NCX sample is colored by the same color in all figures of this article. Scale bar represents 1 cm. See also Tables S1 and S2.

