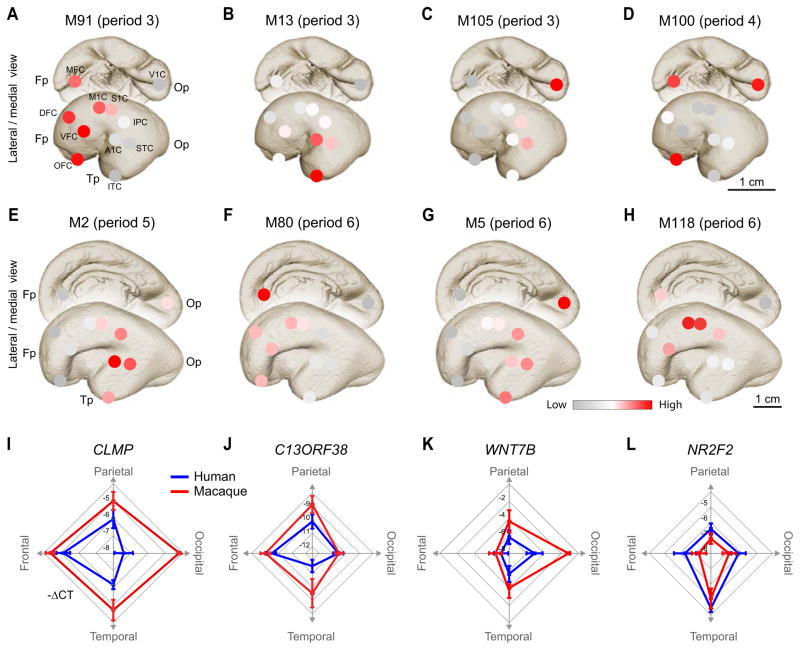
Figure 3. Fetal gene co-expression modules and hub genes in human and macaque monkey.
(A–H) Average scaled-expression of all genes in co-expression module (M) 91, M13, M105, M100, M2, M80, M5, and M118 show a gradient-like expression pattern in periods (A–C) 3, (D) 4, (E) 5, and (F–H) 6. I–L, Radar charts of qRT-PCR of intra-modular hub genes (I) CLMP (M91), (J) C13ORF38 (M80), (K) WNT7B (M6), AND (L) NF2R2 (M13) demonstrate a gradient-like expression pattern in human (blue) in directions of areas grouped by their corresponding lobes (e.g., frontal, parietal, occipital and temporal; versions of these radar charts with all 11 areas across different periods are shown in Figure S3A–L). Rhesus macaque (red) expression patterns are similar to those of human. See also Figures S2, S3, S4, and Table S4.

