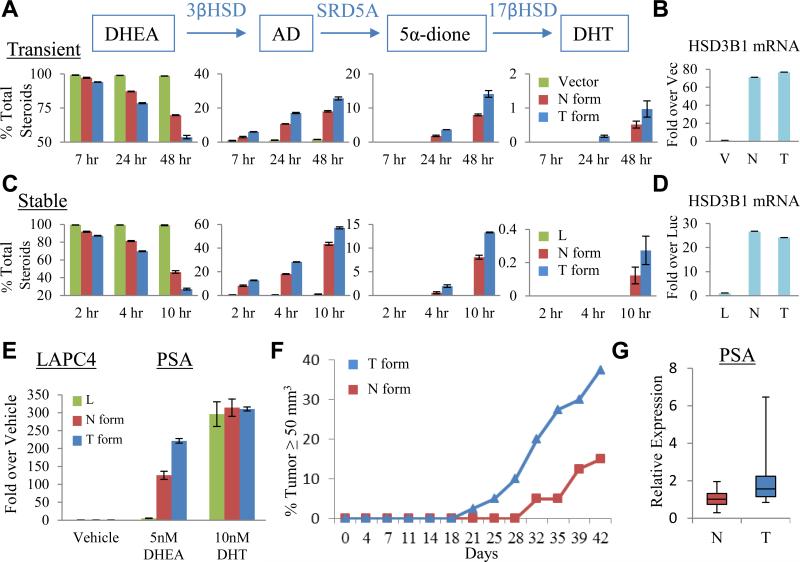
Fig. 6.
3βHSD1(367T) increases metabolic flux from DHEA to DHT and elicits CRPC. (A) Transient expression of 3βHSD1(367T) (T, blue bars) leads to increased conversion from DHEA to AD and downstream steroids compared with 3βHSD1(367N) (N, red bars). LAPC4 cells were transfected with the indicated plasmid, treated with CHX, and cultured with [3H]-DHEA (100 nM); steroids were extracted and measured by HPLC at the designated time points (p-value = 0.023 for the difference in DHT synthesis by the N and T forms using by Student's t-test). (B) Transient transfection results in equivalent expression of both transcripts by qPCR. (C) Stable expression demonstrates increased activity of 3βHSD1(367T). Lentiviral constructs expressing luciferase (L), wild-type (N), or (T), were stably expressed (without CHX treatment) and flux from [3H]-DHEA to DHT was assessed, as described previously (p-value = 0.015 for the difference in DHT synthesis by the N and T forms using Student's t-test). (D) Expression of both enzyme transcripts by qPCR is comparable. (E) Increased flux from DHEA to DHT with stable expression of 3βHSD1(367T) leads to amplified expression of PSA in LAPC4. Cells stably expressing the designated constructs were treated with the indicated steroids for 48 hours. PSA expression induced by the DHT positive control is equivalent among the three cell populations. For B, D and E, expression is normalized to RPLP0 and vector, luciferase, or vehicle controls. Error bars represent the SD for experiments performed in triplicate. (F) Development of CRPC occurs more rapidly in LAPC4 xenografts stably expressing 3βHSD1(367T) as compared with 3βHSD1(367N). Time from subcutaneous injection of cells in each flank to tumor size = 50 mm3 is shown for each tumor that developed in a mouse flank (n = 40 mouse flanks in each group). P=0.017 for the comparison using a log rank test. (G) PSA expression is higher in CRPC tumors expressing 3βHSD1(367T) compared with 3βHSD1(367N) (p-value = 0.015 by Student's t-test). Expression is normalized to RPLP0. Bars represent the upper and lower quartiles of individual tumor values. See also Figure S3.

