
FIGURE 5.
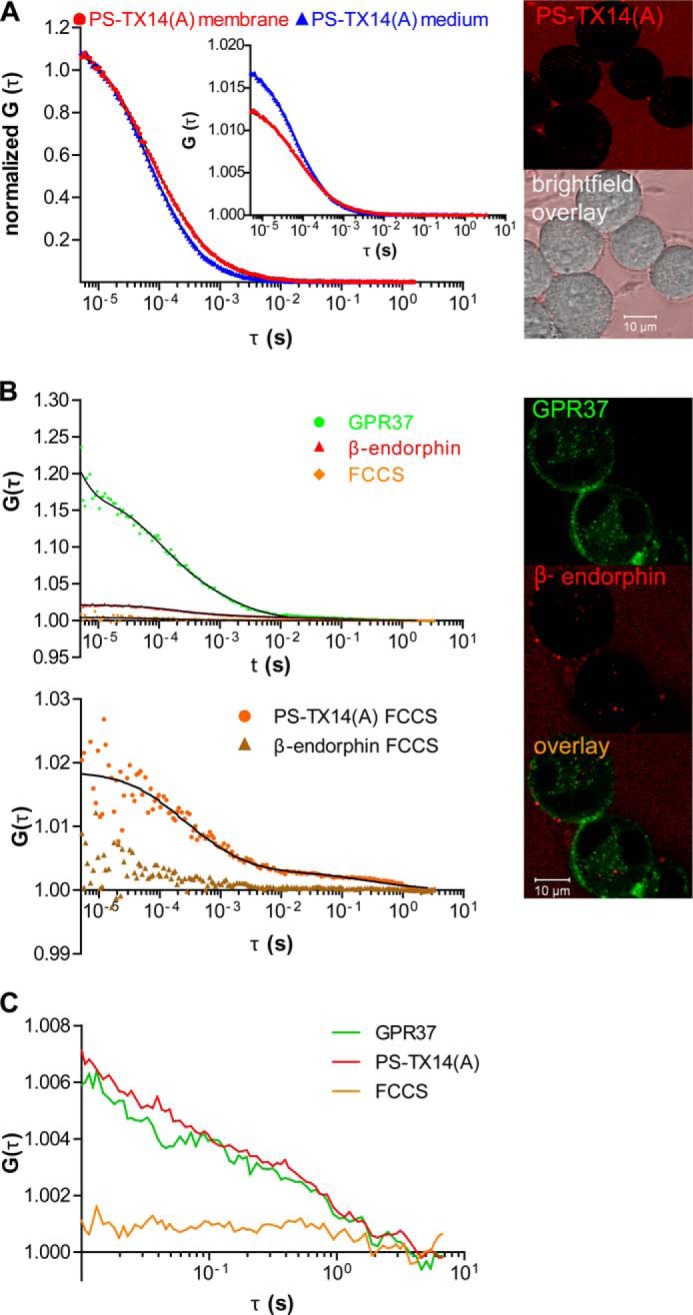
Interactions of PS-TX14(A)TAMRA with GPR37tGFP are specific. A, autocorrelation curves (left panel) recorded in the bulk medium (blue) and on the surface of WT N2a cells (red) show that neither the diffusion nor the concentration of PS-TX14(A)TAMRA are significantly altered at the plasma membrane of WT N2a cells, indicating that PS-TX14(A)TAMRA does not bind nonspecifically to the plasma membrane of WT N2a cells. Representative images (right panel) show limited binding of PS-TX14(A)TAMRA to membranes of WT N2a cells with low expression levels of GPR37. B, top left panel, FCCS measurements showed no cross-correlation between GPR37tGFP and β-EndTAMRA. Bottom left panel, cross-correlation curves confirming interactions between PS-TX14(A)TAMRA and GPR37tGFP reflect specific binding (orange), as compared with lack of cross-correlation between β-EndTAMRA and GPR37tGFP signal (brown). Right panel, representative images show absence of co-localization between β-EndTAMRA and GPR37tGFP. C, autocorrelation and cross-correlation curves for GPR37tGFP and PS-TX14(A)TAMRA using the sequential illumination mode at a switching rate of 100 μs.