
FIGURE 1.
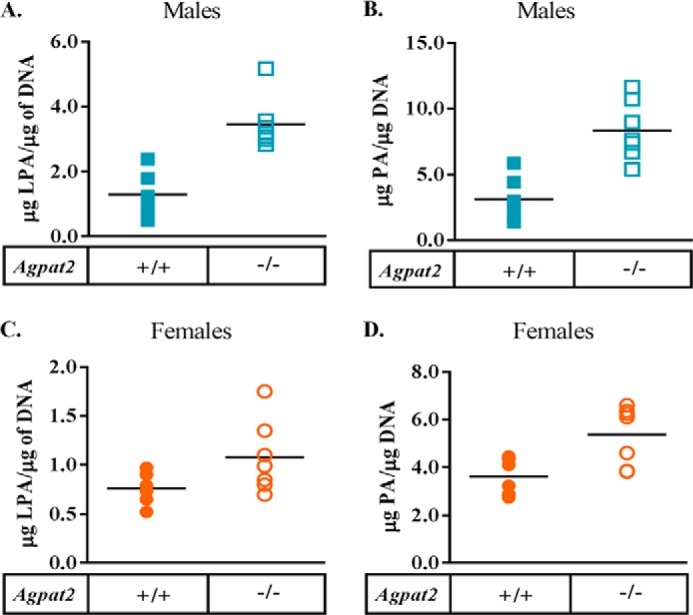
Quantification of LPA and PA in the livers of wild type (WT) and Agpat2−/− mice. LPA and PA were extracted from the livers of 4-month-old WT and Agpat2−/− male and female livers. A and B, LPA and PA levels in WT and Agpat2−/− male livers normalized to DNA. Shown are individual LPA and PA values, n = 6. The p value for LPA and PA was <0.01. C and D, LPA and PA levels in WT and Agpat2−/− female livers normalized to DNA. Shown are individual LPA and PA values, n = 6. p value for PA = 0.01.