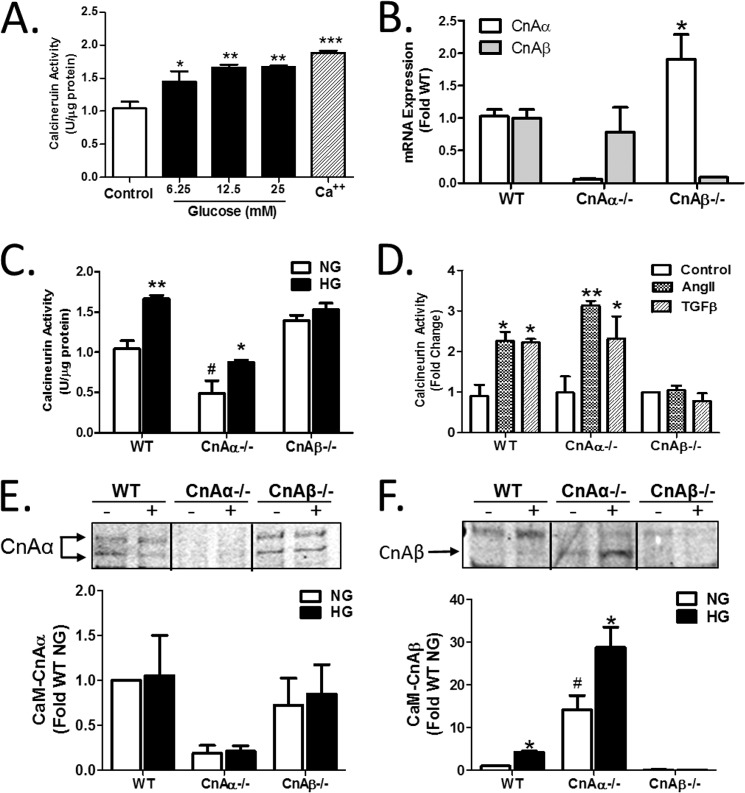
FIGURE 1.
The β isoform of calcineurin (CnAβ) is selectively activated by high glucose. A, Cn enzyme activity in WT kidney fibroblasts exposed to increasing amounts of glucose or calcium (Ca2+) for 10 min was determined by an in vitro Cn assay. Data shown are the mean ± S.E. (error bars) of triplicate reactions. *, p < 0.05; **, p < 0.01; **, p < 0.001 compared with control. B, CnAα and CnAβ mRNA expression in WT, CnAα−/−, and CnAβ−/− kidney fibroblasts was examined by qRT-PCR. Data shown are the mean ± S.E. of 4–9 replicates/group. *, p < 0.05 compared with WT. C, Cn enzyme activity in WT, CnAα−/−, and CnAβ−/− kidney fibroblasts exposed to normal glucose (NG) or HG for 48 h was determined by an in vitro Cn assay. Data shown are the mean ± S.E. of 8 replicates/group. *, p < 0.05; **, p < 0.01 compared with NG; #, p < 0.05 compared with WT NG. D, Cn enzyme activity in WT, CnAα−/−, and CnAβ−/− kidney fibroblasts exposed to angiotensin II or TGF-β for 10 min was determined by in vitro Cn assay. Data shown are the mean ± S.E. of triplicate reactions. *, p < 0.05; **, p < 0.01 compared with control. E and F, association of catalytic isoforms of Cn with calmodulin (CaM) was determined in WT, CnAα−/−, and CnAβ−/− kidney fibroblasts after 48 h of NG or HG exposure by a CaM pull-down assay. Relative amounts of CnAα and CnAβ bound to CaM were semiquantitated by densitometry. Data were normalized relative to WT NG and graphed. Data shown are the mean ± S.E. of four independent experiments. *, p < 0.05 compared with NG. #, p < 0.05 compared with WT NG.

