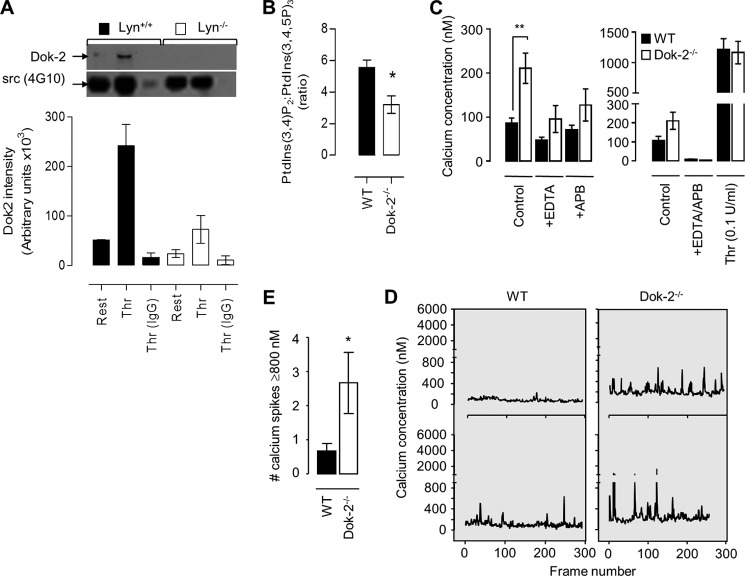
FIGURE 6.
Dok-2 regulates platelet calcium flux and PI(3,4,5)P3 metabolism. A, washed Lyn+/+ and Lyn−/− mouse platelets (5.0 × 10⁸/ml) were left untreated (Rest) or stimulated with thrombin (Thr, 1 unit/ml). Tyrosine-phosphorylated proteins were immunoprecipitated (4G10) from whole cell lysates and blotted for Dok-2 and Src (using 4G10) as described under “Experimental Procedures.” The immunoblot was taken from one experiment representative of three independent experiments, with densitometric quantification presented in the histogram (mean ± S.E., n = 3). B, washed WT and Dok-2−/− platelets were loaded with 32P, stimulated with thrombin (1 unit/ml, 2 min), lysed, and then 32P-labeled phospholipids were extracted and analyzed by strong anion exchange-HPLC as described under “Experimental Procedures.” The histogram depicts the ratio of PtdIns(3,4)P2 to PtdIns(3,4,5)P3 (mean ± S.E., n = 3). *, p < 0.05. C–E, washed WT and Dok-2−/− mouse platelets (2.5 × 10⁸/ml) were loaded with calcium dyes (Oregon green 1,2-bis(o-aminophenoxy)ethane-N,N,N′,N′-tetraacetic acid and FuraRed), and their calcium concentrations (nanomolar) determined under basal and agonist-stimulated (C) or shear (D and E) conditions, as described under “Experimental Procedures.” C, platelets were allowed to rest in the presence or absence of calcium-chelating agents (EGTA (1 mm) and EDTA (1 mm)) and/or the inositol 1,4,5-trisphosphate receptor inhibitor 2-APB (10 μm). In some experiments, platelets were stimulated with thrombin (0.1 units/ml) prior to the determination of cytosolic calcium levels (mean ± S.E., n = 3). **, p < 0.01. D and E, washed platelets were reconstituted with red blood cells, perfused over fibrinogen (100 μg/ml) at 600 s−1, and then the calcium concentration of adherent platelets was determined as described under “Experimental Procedures.” Representative tracings of calcium flux are shown for individual platelets (D). Tracings are from one experiment representative of five. E, the number of calcium peaks ≥800 nm. Data are from 10 platelets/genotype (mean ± S.E., n = 5). *, p < 0.05.

