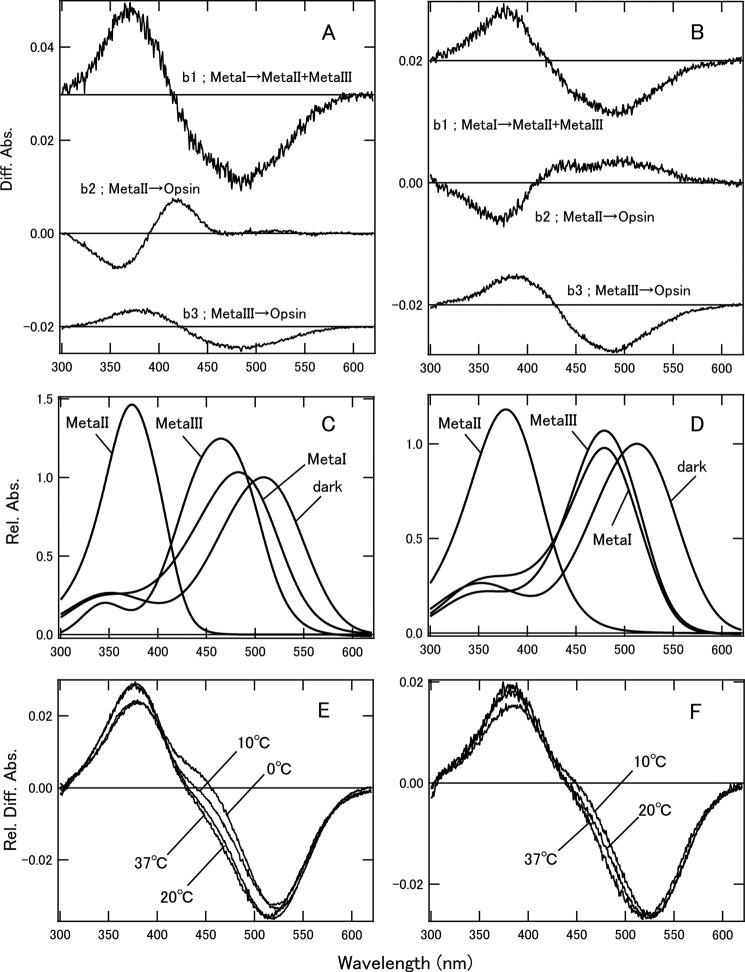
FIGURE 7.
Photobleaching processes and estimation of Meta-II ratios of cG and mG in POPC/POPG nanodiscs. A, b-spectra calculated by SVD analysis of cG in nanodiscs at 20 °C. At 0 and 10 °C, b1 and b2 spectra were consistent with b1 at 20 °C, and b3 and b4 were consistent with b2 and b3, respectively, at 20 °C. At 37 °C, b-spectra were consistent with those at 20 °C. B, b-spectra calculated by SVD analysis of mG in nanodiscs at 20 °C. At 10 and 37 °C, the b-spectra were consistent with those at 20 °C. The time constants of b1, b2, and b3 were 4.9 ms, 79 ms, and 4.6 s, respectively, at 20 °C. C, model absorption spectra of dark state and photobleaching intermediates of cG. Absorption maxima of cG were 508 nm for dark state, 483 nm for Meta-I, 374 nm for Meta-II, and 465 nm for Meta-III. D, model absorption spectra of dark state and photobleaching intermediates of mG. Absorption maxima of mG were 513 nm for dark state, 479 nm for Meta-I, 378 nm for Meta-II, and 479 nm for Meta-III. For details, see the text. E, calculated difference spectra (Beq) of equilibrium states of cG at 0–37 °C. These spectra were fitted by model dark state, Meta-I, Meta-II, and Meta-III spectra to estimate FMeta-II (Table 4). F, calculated difference spectra (Beq) in equilibrium states of mG at 10–37 °C. These spectra were also fitted by the model spectra to estimate FMeta-II (Table 4). Diff. Abs., difference absorbance; Rel. Diff. Abs., relative difference absorbance.

