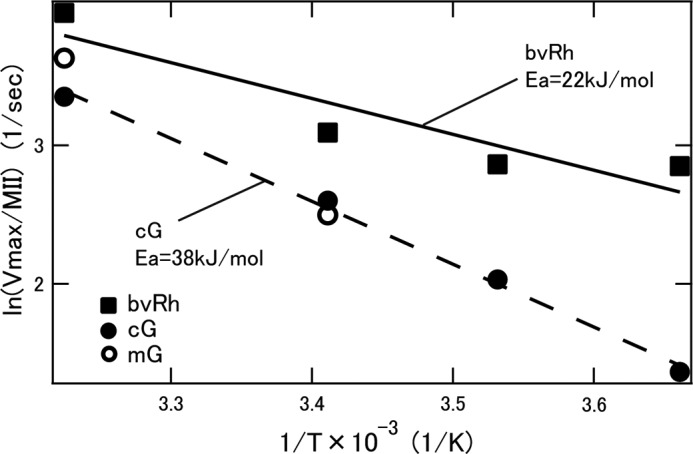
FIGURE 8.

Arrhenius plots of turnover rates (Vmax/MII) of Gt activation by bvRh, cG, and mG (closed squares, closed circles, and open circles, respectively) in POPC/POPG nanodiscs. Plots of bvRh and cG were fitted by straight lines (solid and dashed lines, respectively) to calculate apparent activation energy (Ea).
