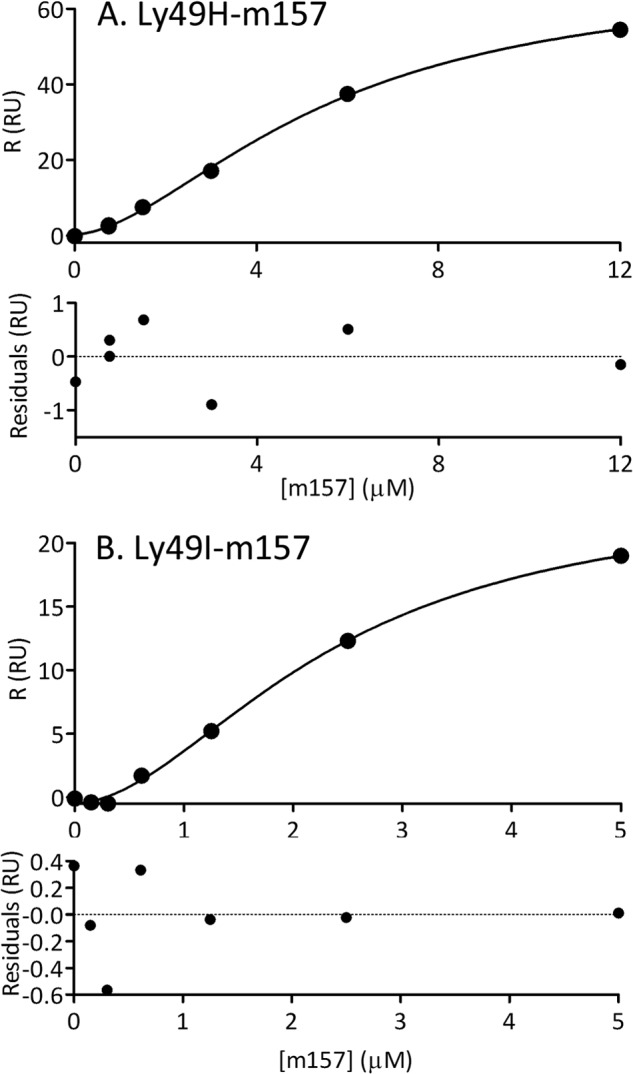
FIGURE 2.

SPR equilibrium analysis. Plots of the maximum response (R) in RU obtained at each m157 total concentration assayed by injection over immobilized ∼100 RU Ly49H (A) and Ly49I (B) at 25 °C. The curves describe the fitting to the Hill equation. The nH coefficient obtained for the Ly49H/m157 pair is 1.7 ± 0.1 and for the Ly49I/m157 pair is 1.9 ± 0.2. Residual errors are indicated below each panel.
