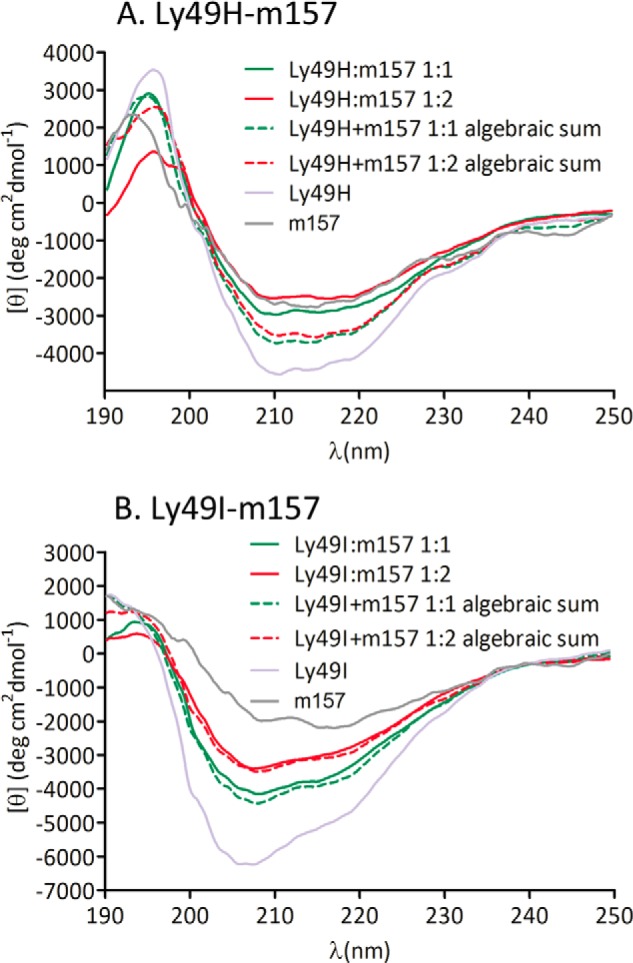
FIGURE 5.

Far-UV CD spectra of Ly49H and Ly49I in combination with m157. Ly49H (A) and Ly49I (B) preincubated with m157 at molar ratios of 1:1 (solid green lines) and 1:2 (solid red lines) and the algebraic sum of spectra of Ly49 and one m157 molecule (dashed green lines) or of spectra of Ly49 and two m157 molecules (dashed red lines) are shown. The difference between the preincubated spectra and the algebraic sum spectra indicates a conformational change upon m157 binding. deg, degrees.
