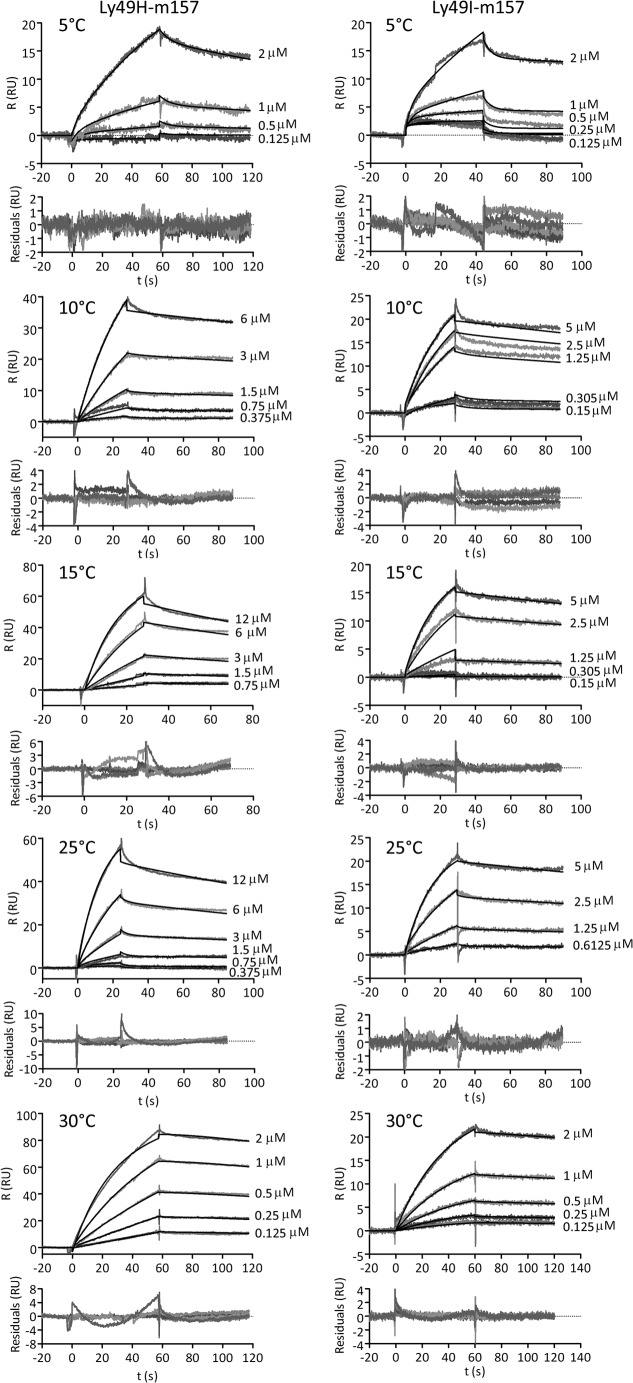
FIGURE 9.
Sensorgrams for Ly49/m157 interactions at different temperatures. Sensorgrams for the Ly49H/m157 and for Ly49I/m157 interactions at 5, 10, 15, 25, and 30 °C are shown. On the side of each sensorgram, the total m157 molar concentration assayed is indicated. Black lines indicate the fitted curves using numerical integration with BIAevaluation 4.1 software from the differential equations of model D. The kinetic rate constants and macroscopic sequential equilibrium constants are shown in Tables 2 and 3, respectively, for the Ly49H/m157 and Ly49I/m157 pairs. R, response.

