Background: PLCβ reverses siRNA down-regulation possibly by binding to the RNA silencing promoter C3PO.
Results: PLCβ binds externally to C3PO to reduce rapid hydrolysis of specific siRNAs.
Conclusion: A model for PLCβ effects on C3PO-mediated siRNA hydrolysis is presented.
Significance: The studies provide a clue of the genes that may be regulated by cytosolic PLCβ.
Keywords: Fluorescence Correlation Spectroscopy, Fluorescence Resonance Energy Transfer (FRET), Phospholipase C, Protein Assembly, siRNA, Enzymatic Rate
Abstract
C3PO plays a key role in promoting RNA-induced gene silencing. C3PO consists of two subunits of the endonuclease translin-associated factor X (TRAX) and six subunits of the nucleotide-binding protein translin. We have found that TRAX binds strongly to phospholipase Cβ (PLCβ), which transmits G protein signals from many hormones and sensory inputs. The association between PLCβ and TRAX is thought to underlie the ability of PLCβ to reverse gene silencing by small interfering RNAs. However, this reversal only occurs for some genes (e.g. GAPDH and LDH) but not others (e.g. Hsp90 and cyclophilin A). To understand this specificity, we carried out studies using fluorescence-based methods. In cells, we find that PLCβ, TRAX, and their complexes are identically distributed through the cytosol suggesting that selectivity is not due to large scale sequestration of either the free or complexed proteins. Using purified proteins, we find that PLCβ binds ∼5-fold more weakly to translin than to TRAX but ∼2-fold more strongly to C3PO. PLCβ does not alter TRAX-translin assembly to C3PO, and brightness studies suggest one PLCβ binds to one C3PO octamer without a change in the number of TRAX/translin molecules suggesting that PLCβ binds to an external site. Functionally, we find that C3PO hydrolyzes siRNA(GAPDH) at a faster rate than siRNA(Hsp90). However, when PLCβ is bound to C3PO, the hydrolysis rate of siRNA(GAPDH) becomes comparable with siRNA(Hsp90). Our results show that the selectivity of PLCβ toward certain genes lies in the rate at which the RNA is hydrolyzed by C3PO.
Introduction
Phospholipase Cβ1–4 is a family of signaling enzymes coupled to the Gαq family of G proteins that respond to many hormones and neurotransmitters (1). PLCβ3 enzymes catalyze the hydrolysis of the lipid phosphatidylinositol 4,5-bisphosphate to produce two second messengers that lead to activation of protein kinase C and increased levels of intracellular calcium (for reviews see Refs. 2, 3). Although the majority of PLCβ resides on the plasma membrane under most cellular conditions, a small but significant population is present in the cytosol under many cellular conditions, and this cytosolic population remains constant throughout the G protein signaling cycle (4–6). The role of this cytosolic population of PLCβ is unclear because the basal activity of the enzyme is very low, and its only known regulator, Gαq, resides on the plasma membrane (4, 7). In an effort to understand this cytosolic population, we searched for novel protein partners and identified the protein translin-associated factor X (TRAX) through a yeast two-hybrid study. Subsequent work verified that TRAX and PLCβ associate both in solution and in cells (8, 9). We also found that TRAX competes with Gαq for PLCβ binding, and overexpression of TRAX ablates Ca2+ signals mediated through Gαq/PLCβ (8).
TRAX is an endoribonuclease that targets ssDNA as well as RNA (for reviews see Refs. 10, 11). Together with its partner translin, an RNA-binding protein, TRAX has been implicated in chromosomal translocations, spermatogenesis, and dendritic RNA trafficking. TRAX and translin form a 2:6 octamer that was recently identified as C3PO (component 3 promoter of RNA-induced silencing complex or RISC), which promotes RNA silencing in cells, embryos, and solution (12–14). In this process, a “guide” RNA strand and its complementary “passenger” strand bind to RISC. C3PO degrades the passenger strand allowing the target mRNA to bind to the guide strand. Although the solution properties of C3PO have yet to be fully characterized, the crystal structures of Archaeoglobus fulgidus (15), Drosophila (13), and human (14) C3PO complexes have been reported. In Drosophila and humans, C3PO is an asymmetric octamer consisting of two translin dimers and two translin-TRAX dimers. In A. fulgidus, C3PO is a homo-octamer of a single species in which two subunits have a TRAX-like orientation, whereas the orientation of the other six subunits are similar to translin.
Our recent studies have indicated that in cells PLCβ interferes with C3PO function, presumably through its interaction with TRAX (8). Specifically, we found that PLCβ can reverse siRNA-mediated down-regulation of the housekeeping enzymes, GAPDH and LDH, although overexpression of TRAX or an activated form of Gαq reverses this effect. However, PLCβ does not affect siRNA down-regulation of Hsp90 or cyclophilin A suggesting that PLCβ only affects the regulation of specific genes. The ability of PLCβ to reverse down-regulation by certain siRNAs for specific genes may be due to several underlying mechanisms. First, these proteins might be compartmentalized leaving only certain populations of RISC available for PLCβ binding. This idea is in line with recent observations of different RISC complexes in cultured Drosophila cells under different environmental conditions (16). Second, there might be variations in the compositions of PLCβ·C3PO complexes that differ in their ability to process RNAs. Third, differences in RNA processing may be intrinsic to C3PO, and PLCβ binding may preferentially affect one or more of its rate-limiting steps.
Here, we have begun to distinguish between these possibilities by studying the cellular localization and the solution properties of C3PO and C3PO·PLCβ complexes. Our studies suggest a fairly uniform cytosolic distribution of PLCβ·C3PO complexes in cells. In solution, we find that one molecule of PLCβ binds to an external site(s) on the TRAX subunits of one C3PO molecule. This binding significantly reduces the rapid nuclease activity of C3PO toward siRNA(GAPDH) making it similar to the slower rate toward siRNA(Hsp90), which is not affected by PLCβ binding. Our results provide a basis for the specific effects of PLCβ on gene silencing and point to differences in the regulation of different genes by the RNA silencing promoter complex.
MATERIALS AND METHODS
Expression and Purification of TRAX, Translin, and C3PO Proteins
The plasmid DNAs for TRAX (pET32a containing a TRX tag and pET15b expression vector containing an N-terminal His6 tag) and translin (pET15b expression vector containing an N-terminal His6 tag) were transformed into Rosetta 2 DE3 competent cells (Novagen). Transformed bacterial colonies were grown at 37 °C in the presence of ampicillin (200 μg/ml) until the absorbance at 600 nm equaled 0.65. Protein synthesis was then induced by incubating with isopropyl β-d-1-thiogalactopyranoside at a final concentration of 1 mm for 1 h at room temperature for TRAX and for 4 h at 37 °C for translin. The cells were harvested and resuspended in lysis buffer (300 mm NaCl, 20 mm Tris-HCl, pH 8, 10 mm β-mercaptoethanol, 1 mm PMSF, 10 μg/ml leupeptin, and 5 μg/ml aprotinin) and sonicated on ice with 1-min pulses each for a total of four times. The lysate was centrifuged at 10,000 × g for 25 min at 4 °C, and the supernatant was incubated with nickel-nitrilotriacetic acid resin for 1 h. Then the solution was loaded onto a column and washed twice with wash buffer (300 mm NaCl, 20 mm Tris-HCl, pH 8, 10 mm β-mercaptoethanol, 5 mm imidazole, and 1 mm PMSF). His-tagged proteins were eluted with increasing concentrations of imidazole (25, 50, 100, 125, 150, and 200 mm) with a majority eluted in the later fractions. The purified proteins (TRAX at 35 kDa and translin at 26 kDa) were analyzed on SDS gels followed by Coomassie Blue staining as well as analyzed by Western blotting with antibodies specific for TRAX (BD Biosciences) and translin (Abcam). The protein concentrations were estimated by Bradford assay and with absorbance measurements at 280 nm.
Recombinant human C3PO in pET Duet-1 expression vector was a generous gift from Dr. Hong Zhang (University of Texas Southwestern at Dallas). C3PO protein was purified following the protocol given in Ref. 12 with slight modifications. Briefly, after induction, cells were harvested and resuspended in lysis buffer (10 mm KOAc, 10 mm Hepes, pH 7.4, 2 mm MgCl2, 5 mm β-mercaptoethanol) with freshly added 1 mm PMSF, 10 μg/ml leupeptin, 5 μg/ml aprotinin, and 20 mm imidazole. Cells were lysed by sonication on ice, and the supernatant was incubated with nickel-nitrilotriacetic acid resin overnight followed by sequential washing with lysis buffer with 1 m NaCl, lysis buffer, and lysis buffer with 50 mm imidazole. C3PO was eluted with lysis buffer containing 250 mm imidazole followed by buffer exchange with 100 mm NaCl, 20 mm Tris-HCl, pH 8.
A catalytically inactive mutant of C3PO was constructed by mutating Asp-193 of TRAX in C3PO to Ala using the QuikChange kit (Stratagene). The mutant was purified as described above, and its cleavage activity was analyzed using nuclease assays.
Purification of PLCβ1/β3
PLCβ1 was purified from HEK293-TAP-PLCβ1 cells that stably express PLCβ1 using Flp-In system (Invitrogen). These cells were a generous gift from Dr. Loren Runnels (Rutgers University). The cells were treated with tetracycline to induce PLCβ1 expression and were harvested 60 h after treatment. The cells were lysed using a homogenizer in buffer A (20 mm Hepes, pH 7.5, 2 mm MgCl2, 5 mm β-mercaptoethanol, 5% glycerol, 0.1 mm EDTA, and protease inhibitors) with 500 mm NaCl. The cleared lysate was added to streptavidin beads, and the beads were washed in buffer A with 500 mm NaCl, followed by an additional wash in buffer A with 100 mm NaCl. The protein was eluted with 2 mm biotin. PLCβ3 purification was carried out as described earlier (17). The experiments described here used PLCβ1, although many solution studies were repeated with PLCβ3 (both gave identical results), and the isoform used is noted in the figures. For simplicity, PLCβ in the text refers to either PLCβ1 or -β3.
Cell Culture and Transfection
HEK293 cells were cultured in Dulbecco's modified Eagle's medium (DMEM) supplemented with 10% fetal bovine serum and 1% penicillin/streptomycin at 37 °C with 5% CO2. Cells were transfected with PLCβ1-eYFP and TRAX-eCFP constructs using FuGENE HD transfection reagent (Roche Applied Science) according to the manufacturer's protocol. DNA and transfection reagent were added at a 3:1 FuGENE/DNA ratio to the cells. The cells were imaged 60 h post-transfection.
Protein Labeling
TRAX, translin, C3PO, and PLCβ were labeled with fluorescent probes as described (18). Reactive fluorescent probes were purchased from Invitrogen. The proteins were labeled either on the N terminus using amine reactive probes (carboxylic acid and succinimidyl ester) or on exposed Cys residues with thiol-reactive probes (maleimide). For labeling with amine reactive probes, the proteins were dialyzed in 20 mm sodium phosphate dibasic, 150 mm NaCl, pH 8.2 buffer, and for Cys labeling, proteins were dialyzed in 20 mm Hepes, pH 7.2, and 150 mm KCl. A 5-fold excess of probe was added to the protein, and the solution was kept on ice for 2 h to achieve a 1:1 labeling ratio. The unconjugated probe was removed with the help of G-25 Sephadex SpinTrap (GE Healthcare) or with dialysis. Both types of labeling resulted in a 0.6–0.8:1 probe/protein ratio as determined by absorption spectroscopy.
Förster Resonance Energy Transfer (FRET) Studies
Using an ISS PCH spectrofluorometer (ISS, Urbana, IL), the intensities of proteins labeled with the donor probe (Alexa488 SE/maleimide) were monitored as increasing concentrations of proteins labeled with an acceptor (i.e. Alexa546/Black Hole Quencher) were added. The fluorescence intensities obtained were corrected with donor-conjugated protein titrated with unlabeled protein or buffer. Increases in FRET were calculated by the decreases in donor intensity that were fitted to a bimolecular association equation using Sigmaplot (Systat Software) to obtain the dissociation constant (Kd).
Fluorescence Correlation Spectroscopy (FCS) Measurements
Measurements of 1–10 nm of Alexa488-PLCβ1 or translin was taken in LabTek chambers on an ISS Alba instrument (ISS, Urbana, IL) as described (19). The instrument was calibrated using 10 nm of rhodamine 6G and rhodamine 110 dyes, and FCS data and photon counting histogram data were analyzed using the Vistavision software.
Live Cell FRET Analysis
Live cells were viewed under an Olympus Fluoview FV1000 laser confocal microscope. Cells in which the expression of both eCFP and eYPF was similar were viewed so that all channels had the same voltage and gain for a specific series of studies, and the FRET efficiency was determined by sensitized emission after correction for bleed through from the eCFP and eYFP channels utilizing images of cells expressing TRAX-eCFP and PLCβ1-eYFP using Olympus software as described (20). This procedure calculates the FRET efficiency (E) as shown in Equation 1,
where ϵ is the fluorescence in the CFP channel, and nFRET is equal to the image obtained in the FRET channel minus bleed through in CFP (a) and YFP (b) channels as shown in Equation 2,
where rΨ is the ratio of the detector response of the CFP and YFP channels, and rQ is the ratio of the quantum yields of the CFP and YFP. This procedure results in an nFRET = 0.5 ± 0.5% for all negative controls, including free eCFP and free eYFP and free eCFP and eYFP-PLCβ1, and 37 ± 1.0% for the positive control (i.e. eCFP-X12-eYFP).
In Vitro Hydrolysis of siRNAs
Fluorescence measurements that monitored the rate of cleavage were carried out on an ISS spectrofluorometer. Double-stranded siRNAs with 5-FAM at the 5′ end of one strand and BHQ1 at the 3′ end of the complementary strand were from Integrated DNA Technologies (IDT). The sequence for the sense strand of GAPDH siRNA is 5′-ACCUGACCUGCCGUCUAGAA-BHQ1-′ and that for the antisense is 5′-6FAM-CUAGACGGCAGGUCAGGUCCA-3′. For Hsp90 siRNA, the sequence for the sense strand is 5′-ACUAAGUGAUGCUGUGAUACC-BHQ1–3′ and for the antisense strand is 5′-6FAM-UAUCACAGCAUCACUUAGUAG-3′. The hydrolysis of oligonucleotides over time was determined by the increase in FAM fluorescence upon BHQ1 cleavage. The rates were calculated by fitting the initial part of the curves to an exponential rise using SigmaPlot (Systat Software).
Nucleotide Binding Studies
The energies associated with nucleotide binding to C3PO were determined by monitoring the increase in fluorescence anisotropy as its rotational motion becomes restricted upon binding to added protein (21). Increase in anisotropy of the FAM-labeled siRNAs values were plotted against concentration, and dissociation constants were obtained by fitting the curves to bimolecular association.
Quenching Studies
Fluorescence of the siRNAs were quenched with the addition of 0–800 mm KI. Data shown are for the fully quenched value (i.e. 800 mm) where the fractional change in intensity was plotted for both siRNAs in the presence of C3PO and PLCβ.
RESULTS
Visualization of PLCβ·TRAX Complexes in Cells
The ability of PLCβ to reverse siRNA down-regulation of some genes but not others may be due to differences in the compartmentalization of the cytosolic populations of PLCβ1 and/or TRAX. We explored this possibility by imaging HEK293 cells expressing eYFP-PLCβ and eCFP-TRAX by confocal fluorescence microscopy and determining the distributions of the two proteins and their complexes. We selected cells that similarly expressed both constructs so that the identical microscope settings could be used for both the CFP and YFP channels. Typical images are shown in Fig. 1. Because PLCβ has a prominent plasma membrane population, its cytosolic component appears weaker than TRAX, although the overall intensities are similar. Also, at the magnification used (0.10 μm/pixel), we find that both proteins are similarly localized in the cytosol with a broad distribution and exclusion from small endosomes. We note that even though the two proteins are not uniformly distributed through the cytosol, they are similarly localized.
FIGURE 1.
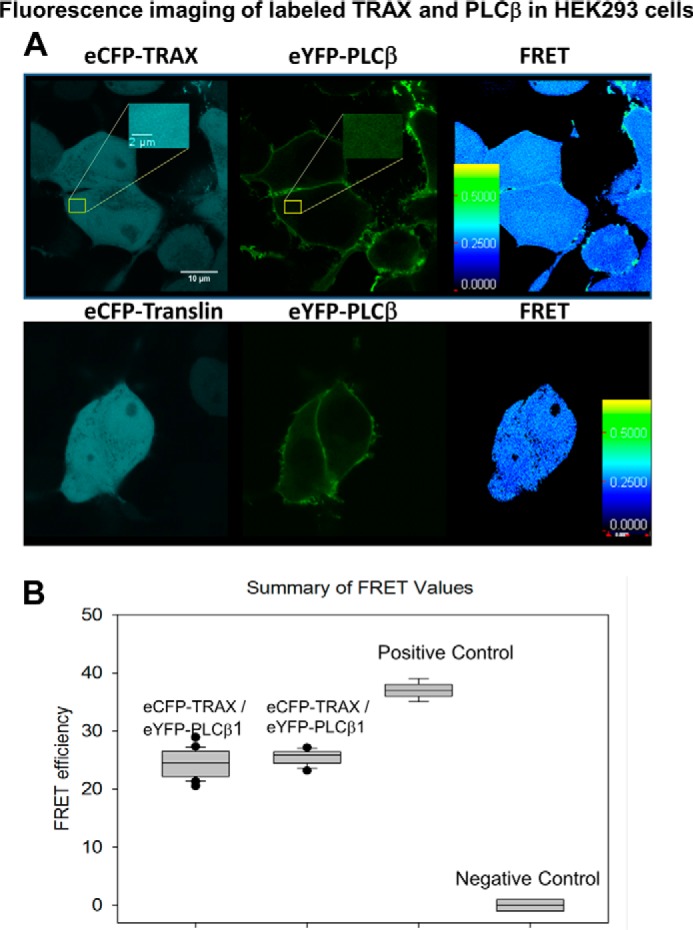
PLCβ1 and TRAX and PLCβ1 and translin are similarly distributed in the cytosol of cells. Top panel, representative images from over 20 HEK293 cells expressing TRAX-eCFP (left), eYFP-PLCβ1 (middle), and the corresponding FRET image (right). The insert is an expanded region of the cytosol. Middle panel, similar images for translin-eCFP (left), eYFP-PLCβ1 (middle), and the corresponding FRET image (right). Bottom panel, box plot of the resulting values of the FRET images along with negative and positive control (see text for details).
We have found that PLCβ and TRAX bind strongly in solution and form complexes in cells (8, 9), and here we determined the distribution of eYFP-PLCβ·eCFP-TRAX complexes using FRET. We find a very high and uniform range of FRET values throughout the cytosol (FRET = 24.4 ± 0.3% (n = 36)). To better understand this value, we can compare it to a positive control in which the two fluorophores are linked by a 12- amino acid peptide (37 ± 1%) and negative control using the free fluorophores (20) or eYFP-PLCβ1 and free eCFP (0.5 ± 0.05%). The result suggests a high degree of association between the two proteins in the cytosol (normalized FRET = 66.0 ± 0.8%).
In a similar series of studies, we monitored the distribution and association of eYFP-PLCβ and eCFP-translin (Fig. 1, bottom panels). We find that the distribution of eCFP-translin in the cytosol of HEK293 cells is identical to eCFP-TRAX, and the level of FRET as well as the normalized FRET value between PLCβ and translin are the same within error as between eCFP-TRAX (25.4 ± 1.2% and 65.4 ± 3.1% (n = 12)). Because the affinity between PLCβ and translin is much weaker than for TRAX or C3PO (see below), these results suggest that PLCβ is associating with TRAX-containing C3PO complexes in cells.
Characterization of Translin-TRAX Solution Properties and C3PO Assembly
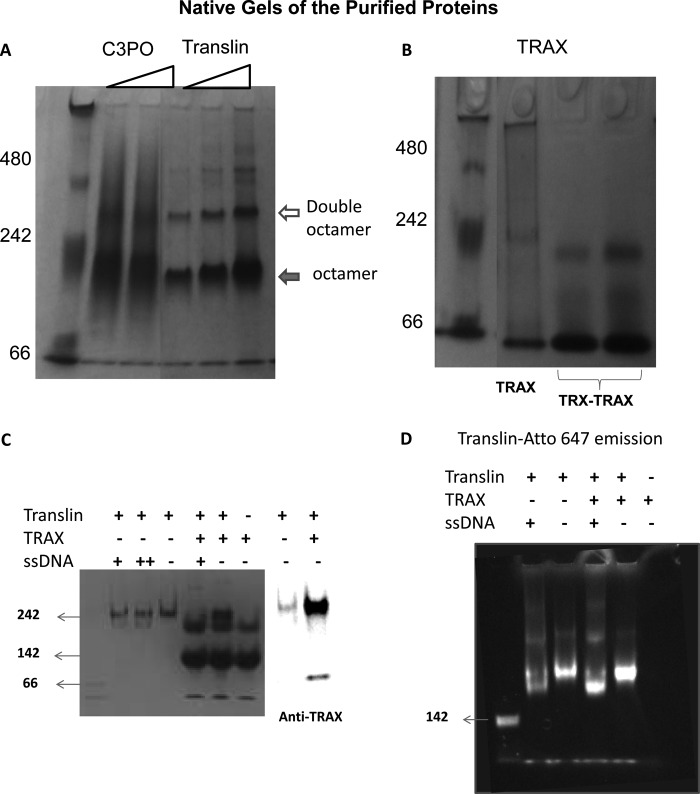
In initial studies, we characterized the oligomerization state of purified TRAX, translin, and C3PO in solution using native gel electrophoresis. We find that both C3PO and translin are mainly octamers in accord with previous work (22), whereas the major population of TRAX has a mobility close to a dimer (Fig. 2, A and B). Higher order aggregates seen for translin and C3PO, but not TRAX, are attributed to the high concentrations of proteins required for these studies. We also find that TRAX/translin mixtures display an intense band with the same electrophoretic mobility as C3PO and purified translin. This octameric band contains TRAX, as seen by Western blotting, and translin, as seen by fluorescence using Atto647-translin, and is capable of binding nucleotides (Fig. 2, C and D). These results support the idea that purified translin and TRAX combine to form the C3PO octamer.
FIGURE 2.
Aggregation states of the purified proteins. A, 5% Coomassie-stained native gel, pH 8, is shown with increasing concentrations of C3PO (1 and 2 μm, 226 kDa) and translin (0.75 μm, 1 μm, 26 kDa) from left to right where the filled arrow refers to the octamer band, and the open arrow refers to a double octamer. B, similar native gel with 0.5 μm TRAX (35 kDa) and 3 μm of TRX-TRAX (2 right lanes), where the TRX tag is used for purification, is shown. C, 5% native gel is shown with 0.5 μm translin, 1 μm TRAX, and 0.5 μm ssDNA (+) or 1.5 μm ssDNA (++) as indicated. The TRAX band of the TRX/TRAX mixture on the native gel was identified by Western blotting on a similar gel probed with an antibody for TRAX (BD Biosciences), where a small amount of staining is noted for translin. D, translin labeled with Atto-647 at its N terminus is shown on a native gel (0.5 μm translin, 1 μm TRAX, and 0.5 μm ssDNA). The 1st lanes for both C and D (unlabeled) are molecular mass markers corresponding to 142 kDa.
We then monitored the association between purified TRAX and translin to form C3PO by FRET. In these studies, TRAX was labeled on the N terminus with a FRET donor (Alexa488), and translin was labeled either on the N terminus or on a Cys side chain (both gave identical results) with a FRET acceptor (Alexa546). Because purified translin appears to oligomerize to an octamer, then in order for it to bind to TRAX, it must dissociate into tetramers, dimers, and monomers, and similarly, the TRAX dimer may also be required to dissociate, depending on the assembly pathway. We note that these FRET measurements will only be sensitive to the association between TRAX and translin and not to changes in the association state of the homo-oligomers.
FRET between TRAX and translin was determined by the decrease in the donor intensity as acceptor is incrementally added to the donor solution (Fig. 3). Based on the observations that TRAX remains a dimer when bound to translin (see below) and that the molecular weight of the complex is comparable to an octamer as seen by native gel electrophoresis (Fig. 2), we believe that the associated complex represents C3PO. In the titration shown in Fig. 3, we find a smooth titration curve suggesting that if there is more than one type of association, then the energies of binding are similar. For simplicity, we fit the resulting titration curves to a bimolecular association constant to obtain an apparent affinity of Kd = 14.4 ± 4.3 nm, which is comparable with the association energy found between TRAX and PLCβ (Kd = 8 ± 1 nm) (9). It is also notable that the presence of excess oligonucleotide does not affect the association between translin and TRAX (Fig. 3B).
FIGURE 3.
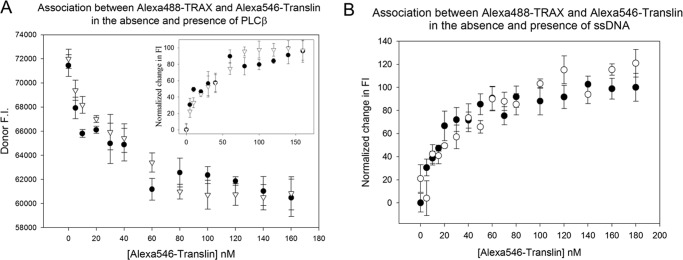
TRAX-translin association is not affected by PLCβ or oligonucleotides. A, FRET studies monitoring the decrease in fluorescence intensity (F.I.) in arbitrary units of 2 nm Alexa488-TRAX (FRET donor) and as Alexa546-translin (FRET acceptor) are added (●) in the absence or presence (▿) of 100 nm PLCβ. Although initially PLCβ1 was used, the data presented used PLCβ3. Both gave identical results. The data presented are a compilation of n = 9 experiments, and S.D. is shown. B, identical FRET study as described in A comparing the association between Alexa488-TRAX and Alexa546-translin in the absence (●) or presence (○) of 100 nm ssDNA where n = 3, and S.D. is shown.
PLCβ Does Not Affect C3PO Assembly
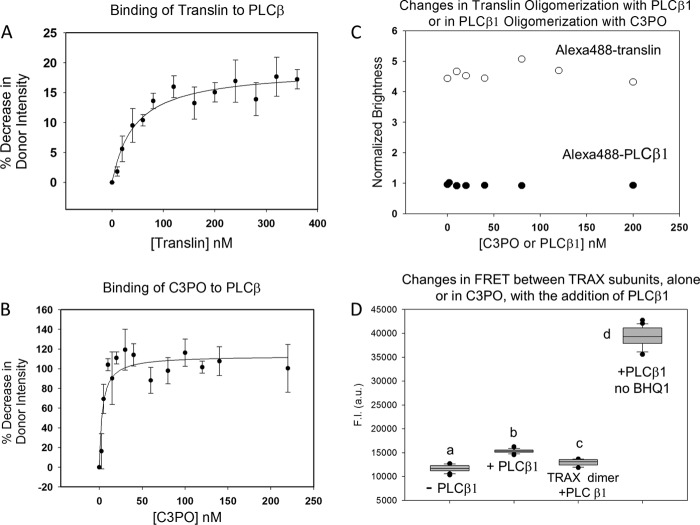
Before determining whether PLCβ incorporates into C3PO, we characterized the affinity between PLCβ and translin and C3PO octamers using a similar FRET approach as described above. We find that PLCβ binds more weakly to translin than to TRAX (Fig. 4A). Again, the titration curves show only one discernible binding event. From these curves, we calculated the bimolecular association constant and find that the apparent affinity between translin and PLCβ is ∼40 nm, which is ∼5-fold weaker than between TRAX and PLCβ.
FIGURE 4.
Association between PLCβ, translin, and C3PO. A, binding studies monitoring the increase in FRET as seen by the % decrease in donor intensity of 20 nm Alexa488-PLCβ1 with the addition of Alexa546-translin, n = 6; B, binding studies monitoring the decrease in fluorescence of 2 nm of Alexa488-PLCβ1 or β3 with the addition of BHQ1-C3PO, n = 9. Note that the concentrations of translin and C3PO refer to the total concentrations of the protein and do not refer to the concentration of protein octamers. C, changes in oligomerization Alexa488-translin as PLCβ1 is incrementally added or changes in oligomerization of Alexa488-PLCβ1 as C3PO is added where changes in oligomerization were monitored by brightness values derived from PCH analysis of FCS data, and where the values are relative to free Alexa488 (n = 4–8). The relative brightness of Alexa488-translin is lower than the expected value of 8, which we interpret as being due to the labeling ratio (∼0.6:1 Alexa488/translin). The diffusion coefficient is consistent with a higher order oligomer (i.e. D = 28 ± 2μ2/s) and does not significantly change with PLCβ1 binding (D = 30 ± 2μ2/s). These data support the idea that one PLCβ molecule associates to the translin complex. If a larger number of PLCβ bound to translin, a change in diffusion would have been observed. D, results showing that TRAX maintains a dimer alone or in C3PO with the addition of PLCβ1. Alexa488-TRAX is reconstituted with BHQ1-TRAX (to quench Alexa488 fluorescence) and translin at a 1:1:6 stoichiometry in the absence (a) or presence (b) of 120 nM PLCβ1 (n = 2,6). Also shown are the intensities for the Alexa488-TRAX/BHQ1-TRAX dimer (i.e. not in the context of C3PO) with PLCβ1 (c) or Alexa488-TRAX/translin (2:6) without quencher and with PLCβ1 (d) (n = 2). These results suggest that PLCβ does not displace a TRAX subunit from the TRAX dimer or C3PO octamer. fluorescence intensity (F.I.). a.u., arbitrary units.
For comparison, we measured the affinity between PLCβ and C3PO. We find that PLCβ binds to C3PO with strong affinity (Kd = 3.8 ± 1.5 nm) with only a single visible binding event (Fig. 4B). We note that the C3PO-PLCβ affinity is ∼2-fold stronger than the value obtained for TRAX-PLCβ (9). The simplest interpretation of these data is that the primary binding site(s) between PLCβ and C3PO is on the TRAX subunits (see below).
If PLCβ is incorporated into C3PO, we would expect it to affect the association between translin and TRAX. We monitored TRAX-translin association by FRET as described above in the presence of excess PLCβ. As shown in Fig. 3, the TRAX-translin association curve was unchanged in the presence of the enzyme suggesting that PLCβ does not bind to the interfaces between TRAX and translin subunits and thus does not incorporate into the octamer.
PLCβ Binds to C3PO with a 1:1 Stoichiometry
C3PO contains two TRAX molecules that bind PLCβ with high affinity and six molecules of translin that bind PLCβ with a lower affinity, although alternative translin/TRAX stoichiometries in solution cannot be ruled out (13). Thus, it is possible that multiple PLCβ molecules can attach to a single C3PO. To determine the number of PLCβ molecules on C3PO, we labeled PLCβ with Alexa488 at an ∼1:1 molar ratio on the N terminus, which is located far from the C-terminal region that binds to C3PO (9) and carried out in diffusion studies using FCS. From these measurements, we can use PCH analysis of the intensity fluctuations with time, as measured on an FCS instrument, to determine the molecular brightness (19). The molecular brightness refers to the number of photons associated with a diffusing species and can suggest the state of oligomerization (23). We have found by column chromatography and by FRET that PLCβ is a monomer at least below ∼200 nm.4 Thus, if we observe an increase in the molecular brightness with the addition of C3PO at concentrations above the dissociation constant, then this will indicate that multiple molecules of PLCβ are binding to C3PO.
We measured the diffusion coefficient and brightness of 5 nm Alexa488-PLCβ with C3PO at different molar ratios of PLCβ and C3PO. All complexes showed similar brightness values that were slightly less than free Alexa488 (Fig. 4C). This constant level of Alexa488-PLCβ brightness with increasing concentrations of C3PO suggests that the major population of PLCβ is monomeric in both the free and C3PO-bound forms. These results imply that PLCβ·C3PO complex is best described by a 1:1 stoichiometry and that C3PO contains only one strong binding site for PLCβ. Unfortunately, the change in size of free and complexed PLCβ1 is not large enough to produce a measurable change in the diffusion coefficient.
It is possible that PLCβ incorporates into C3PO by displacing a translin subunit. To test this idea, we measured changes in the brightness of Alexa488-translin (10 nm) in the presence of 0–200 nm PLCβ (Fig. 4C). Again, we could not detect a significant change in the brightness of translin suggesting that PLCβ does not change the oligomerization of the translin octamer.
In a corroborating series of studies, we tested whether PLCβ displaces a TRAX subunit from C3PO using fluorescence quenching. Here, we labeled one population of TRAX with Alexa488 and a second with BHQ1. We then reconstituted the C3PO octamer at an Alexa488-TRAX/BHQ1-TRAX/translin ratio of 1:1:6. This reconstitution caused a substantial reduction in Alexa488-TRAX fluorescence due to its proximity to BHQ1-TRAX as compared with control samples consisting of Alexa488 TRAX/translin (2:6) (Fig. 4D). We then monitored changes in the intensities of these complexes as PLCβ is added. If PLCβ induced dissociation of one or both TRAX molecules from C3PO, we would expect to see an increase in Alexa488-TRAX intensity. However, no changes in fluorescence could be seen with PLCβ addition (Fig. 4D). Taken together, these studies suggest that a single PLCβ molecule binds to one or both of the TRAX subunits of a single C3PO molecule without affecting subunit interactions within C3PO or its stoichiometry.
C3PO Hydrolyzes RNAs at Different Rates and Only the Faster Rates Are Affected by PLCβ
To gain further insight into the reason why PLCβ reverses siRNA silencing of GAPDH and LDH but not Hsp90 or cyclophilin A, we undertook a functional approach. In this series of studies, we determined whether PLCβ affects the ability of C3PO to bind and hydrolyze siRNA(GAPDH) and siRNA(Hsp90). To this end, we synthesized a doubled-stranded version of siRNA(GAPDH) and siRNA(Hsp90) by placing a fluorescent probe (FAM) on the 5′ end and a fluorescent quencher (BHQ1) on the 3′ end of the complementary strand (see under “Materials and Methods”). We first measured the binding of the siRNAs to translin, which serves the nucleotide binding function of C3PO, and to C3PO that was rendered inactive by introducing a point mutation into human TRAX (Asp-193 to Ala of TRAX of human C3PO (14)). Binding was monitored by the increase in fluorescence anisotropy due to the increase in rotational volume of the labeled nucleotide as it binds to either the translin or catalytically inactive C3PO (e.g. Fig. 5). We find that binding of either siRNA to translin is stronger than to inactive C3PO (Kd(translin − siRNA(GAPDH)) = 1.9 ± 0.5 nm, and Kd(translin − siRNA(Hsp90)) = 3.4 ± 1.2 nm, Kd(C3PO − siRNA(GAPDH)) = 8.2 ± 1.8 nm and Kd(C3PO − siRNA(Hsp90) = 6.5 ± 0.8 nm) presumably due to the presence of lower affinity TRAX subunits for nucleotides (24). In either study, the inclusion of high concentrations (200 nm) of PLCβ, such that the nucleotide binds to the translin octamer·PLCβ or C3PO·PLCβ complex, does not greatly change the affinities between translin and siRNA(GAPDH) (Kd = 4.4 ± 1.9 nm) or siRNA(Hsp90) (Kd = 5.3 ± 2.2 nm), and it produces only minor increases in affinity for inactive C3PO (Kd(siRNA(GAPDH)) = 6.5 ± 0.8 nm and Kd(siRNA(Hsp90)) = 2.6 ± 0.7 nm) (Fig. 5). These data suggest that PLCβ does not impact C3PO function by changing the binding properties of the complex.
FIGURE 5.
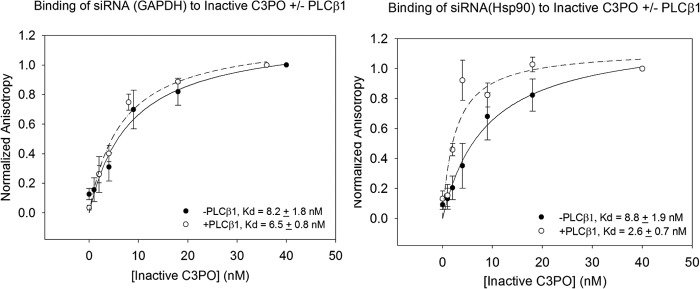
Binding of siRNAs to inactive C3PO. Association between inactive C3PO and 2 nm FAM-siRNA(GAPDH) (left panel) or 2 nm FAM-siRNA(Hsp90) (right panel) as followed by the increase in fluorescence anisotropy, n = 3, where the values were normalized to 0.015 and 0.0180, respectively, in the absence (●) and presence (○) of 200 nm PLCβ1. Binding to PLCβ1 was not observed.
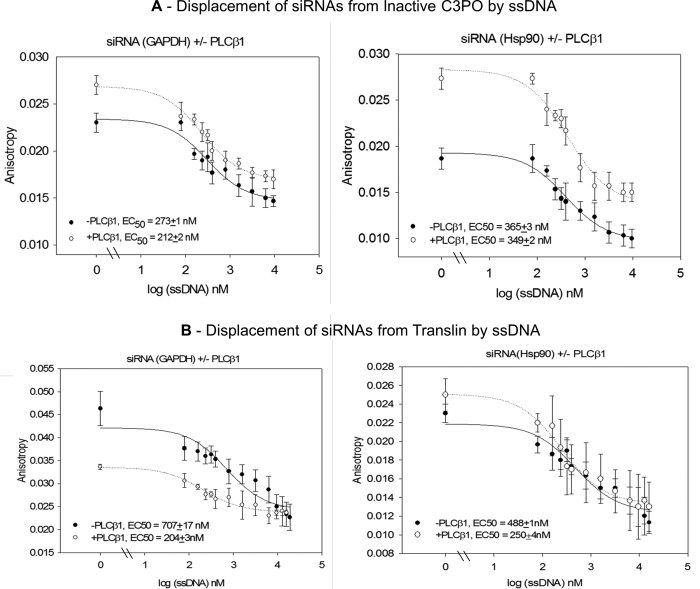
We measured differences in the dissociation of siRNA from the inactive C3PO or translin nucleotide-binding sites using a competition assay. These studies were carried out by binding the siRNAs to proteins at a 1:8 stoichiometric ratio and following their displacement with the addition of single-stranded DNA (e.g. Fig. 6). Here, we find that a smaller amount of ssDNA was needed to displace siRNA(GAPDH) from inactive C3PO as compared with siRNA(Hsp90) suggesting somewhat stronger binding of the latter species (Fig. 6A). Both curves were slightly reduced in the presence of bound PLCβ. Surprisingly, both nucleotides bound much more strongly to translin and were dramatically weakened in the presence of PLCβ (Fig. 6B). This behavior may be due to the multiple low affinities of translin for PLCβ molecules that could affect the molecular movements needed for nucleotide binding to the translin octamer (see “Discussion”).
FIGURE 6.
Displacement of 2 nm siRNAs from 200 nm inactive C3PO and translin. FAM-siRNA(GAPDH) (left panel) and FAM-siRNA(Hsp90) (right panel) were displaced from inactive C3PO (A) or translin (B) by excess unlabeled ssDNA as followed by the decrease in fluorescence anisotropy of the labeled siRNA where the initial point is [ssDNA] = 0 nm. Repeating the studies in the presence of 2.5-fold excess PLCβ1 (500 nm) had little effect on the dissociation curves where n = 6–9 and S.E. is shown. The EC50 refers to the concentration of ssDNA that must be added to displace 50% of siRNA.
Differences in the binding and displacement of the two siRNAs imply differences in nucleotide structure. To test this idea, we measured the ability of KI to quench the fluorescence of the nucleotides before and after binding to C3PO. In the absence of protein, siRNA(Hsp90) was quenched by KI to a higher degree as compared to siRNA(GAPDH) suggesting a less stable structure (Fig. 7). However, the quenching of both nucleotides was high and similar when bound to active C3PO, suggesting that the fluorophores are held in the binding site similarly in the octamer before and after hydrolysis, and we note that the similar anisotropies of the bound siRNAs (Fig. 5) support this idea. Repeating the KI quenching studies with PLCβ results in similar quenching of the two siRNAs. These results imply that the binding pocket of C3PO similarly protects the nucleotides from solvent, and this protection decreases when the complex contains PLCβ. Differences in quenchability lie in the unbound structures of siRNA.
FIGURE 7.
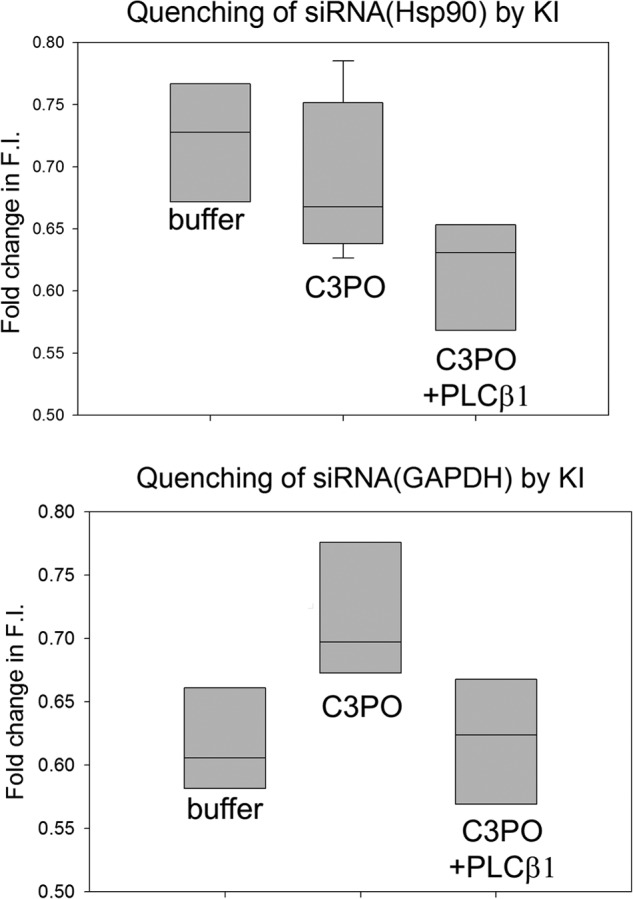
Quenching studies suggest differences in siRNA structure. Shown is the maximum quenching by KI of solutions containing 2 nm FAM-siRNA(Hsp90) (top panel) or FAM-siRNA(GAPDH) (bottom panel) (n = 6), either free or bound to 200 nm C3PO (n = 9) or 200 nm C3PO/500 nm PLCβ1 (n = 9). Nucleotides were incubated with C3PO or C3PO-PLCβ1 for 10 min before adding to the cuvettes. The data here represent the end points of the titration curves taken at 800 mm KI where the maximum value for all samples was reached within 600 mm KI. Although quenching of the protein-bound complexes is not significantly different, quenching of the free siRNAs differ (p = 0.005). F.I., fluorescence intensity.
We then measured the differences in the rates of hydrolysis of the two siRNAs. Although the doubly labeled siRNAs are mildly fluorescent in solution, after cleavage by C3PO their intensities increase 2.5-fold as the distance between the FAM fluorophore and BHQ1 quencher increase, thus allowing us to easily follow their hydrolysis in real time on a fluorometer. The addition of active C3PO to the labeled siRNA(GAPDH) resulted in a rapid increase in fluorescence as the siRNA is hydrolyzed (Fig. 8A). A much slower increase is seen for siRNA(Hsp90) hydrolysis. No changes in fluorescence could be detected in the absence of C3PO or when only PLCβ was added (data not shown). We then repeated C3PO-catalyzed hydrolysis of the siRNAs in the presence of PLCβ. We find that PLCβ significantly reduces the rate of hydrolysis of siRNA(GAPDH) (Fig. 8B). In contrast, the rate of hydrolysis of siRNA(Hsp90) was not affected. These results show that the binding of PLCβ to C3PO directly affects the catalytic rate toward certain siRNAs in accord with its ability to reverse silencing of specific genes.
FIGURE 8.
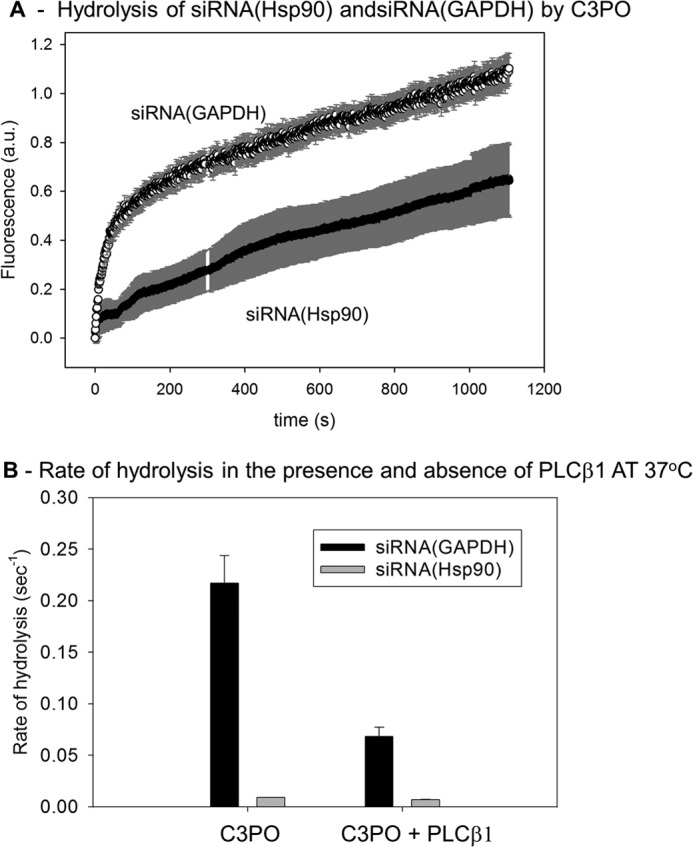
Rates of hydrolysis by C3PO and the impact of bound PLCβ1 differ for different siRNAs. A, curves showing the real time rates of hydrolysis of 2 nm siRNA(GADPH) and 2 nm siRNA(Hsp90) by 200 nm C3PO followed by dequenching of the 5′-terminal FAM probe from the 3′ BHQ. This study was done at 25 °C and is an average of three trials. a.u., arbitrary units. B, compilation of the rates of hydrolysis of 2 nm siRNAs by 200 nm C3PO in the absence or presence of 500 nm PLCβ mixture. C3PO was incubated with PLCβ1 for 10 min before adding siRNA.
DISCUSSION
We have previously found that PLCβ has the ability to reverse siRNA down-regulation of specific genes, and here we have focused on understanding the underlying mechanism. We first imaged PLCβ and TRAX using confocal microscopy to determine how these proteins and their complexes are distributed through the cell. The rationale for this study is that cell fractionation studies have suggested the presence of different RISC complexes on cellular membranes and polysomes (16). We note that we assume that eCFP-TRAX is complexed with translin especially because the expression of the two proteins are so coupled (25) and because we have obtained identical results using eCFP-translin (Fig. 1), although we cannot entirely prove that TRAX and translin are complexed with other unknown proteins.
We imaged the proteins at 100 nm/pixel and noted that the crystal structure of PLCβ3 (∼150 kDa) in complex with Gαq (a spherical 42-kDa protein), has the dimensions of ∼20 × 0.9 × 0.9 nm (26), whereas C3PO can be approximated as an ∼0.9 nm sphere (14). Thus, the PLCβ·C3PO complex is an order of magnitude smaller than the size of a pixel. Sequestration would only be resolved if they are associated with a larger protein complex such as the RISC machinery, but this is not seen. Additionally, the cytosolic distribution of TRAX, translin, and PLCβ are indistinguishable arguing against sequestration of one or more of the proteins. These results suggest that if distinct populations of TRAX exist, they only involve complexation with a small number of proteins.
Although the overexpressed proteins may interact with many cellular partners, we observe a uniform distribution of FRET values in the cytosol. Importantly, the level of FRET is high when compared with positive and negative controls. FRET is very sensitive to the distance between the fluorophores (i.e. (distance)6 see Refs. 27, 28). We have previously found that TRAX binds to a similar site on PLCβ as Gαq (9), and so we can calculate the distance between the outer midpoint of Gαq and the N terminus of PLCβ (starting at residue 18 (26)). This distance, 46 Å, is close to the distance at which 50% FRET occurs (i.e. ∼30 Å, for eCFP/eYFP (29)) and is consistent with a high degree of PLCβ·TRAX association as compared with isolated TRAX. This high FRET value suggests that a large and significant population of C3PO is complexed with PLCβ in the cytosol under our overexpressed conditions. Our previous studies support the idea that the endogenous proteins are associated in the cytosol (8, 9).
To glean mechanistic information about the interaction between PLCβ and C3PO, we studied their properties in solution. Native gel electrophoresis showed that TRAX and translin subunits associate to form an oligomer whose size corresponds to an octamer that contains both subunits suggesting association to C3PO. Additionally, FRET measurements suggest that we can reconstitute C3PO with the addition of purified TRAX and translin. Throughout this study, we have assumed a 6:2 translin/TRAX stoichiometry consistent with crystallographic results, but it is important to note that the electron microscopy characterization of Drosophila C3PO could not discount a 5:3 translin/TRAX ratio (13). It is possible that octamers with multiple stoichiometries occur in solution, and our data cannot distinguish between these possibilities. However, our PLCβ binding results are most easily interpreted as interacting with a 6:2 translin/TRAX octamer.
Characterizing these solution properties then allowed us to better define their interactions. The combination of fluorescence binding measurements and PCH analysis of fluorescence correlation data all suggest that PLCβ binds strongly to external site(s) on one or both of the TRAX subunits of C3PO at a 1:1 stoichiometry. Support for this model comes from the following: 1) the 2-fold higher binding affinity of PLCβ for C3PO than for TRAX as compared with the much weaker affinity for translin; 2) the inability of PLCβ to have a detectable affect on translin-TRAX assembly to an octamer; 3) the similar brightness of PLCβ when free or bound to C3PO; 4) the similar brightness of translin with PLCβ binding suggesting its oligomeric state is unchanged, and 5) the constant amount of FRET between two TRAX subunits of C3PO with PLCβ binding. It is tempting to speculate that the extended helical C-terminal region of PLCβ binds on the exterior between the two TRAX subunits of C3PO. These observations lead to the model presented in Fig. 9 for the PLCβ·C3PO complex.
FIGURE 9.
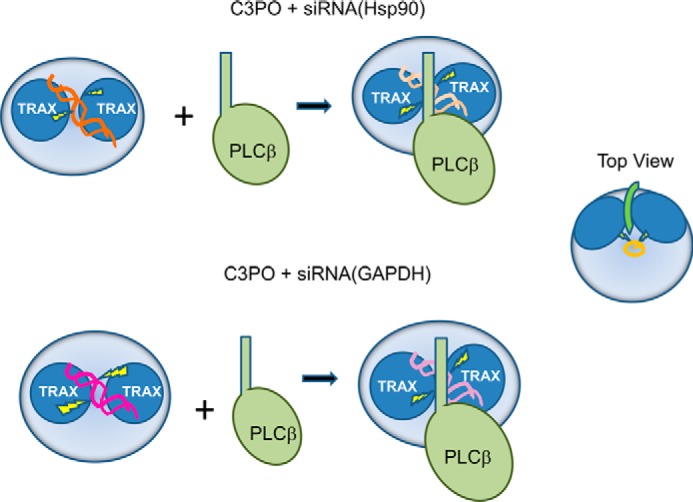
Model of differences between C3PO hydrolysis of siRNAs in the presence of PLCβ. As shown in the leftmost schematic, the two subunits of TRAX (dark blue circles), residing in the C3PO octamer (large light blue circles) bind siRNA(GAPDH) (pink helices) slightly differently than siRNA(Hsp90) (dark orange helices) resulting in more efficient and rapid hydrolytic interactions (yellow lightning bolts). In the presence of bound PLCβ (light green), the interactions with siRNA(GAPDH) (light pink helices) become similar to siRNA(Hsp90) (light orange helices) allowing for comparable hydrolytic rates. The schematic to the far left is a top view on the complex showing only the C-terminal tail of PLCβ. In this model, the C terminus lies on top of the octamer and in between the TRAX subunits. The oligonucleotide is depicted in orange.
Our measurements suggest that oligonucleotides play little role in regulating the interactions between these proteins. Initially, we find that the association between TRAX and translin is similar whether or not oligonucleotide is present, which correlates well with structural studies showing that bound nucleotide does not contact key subunit contacts in C3PO (15). C3PO nucleotide binding is primarily through translin, and we can describe the equilibria we have studied in the following thermodynamic cycle (Reaction 1), where translin could replace inactive C3PO,
 |
Our measurements show that PLCβ does not strongly affect binding of either siRNAs to translin or C3PO (Table 1 and Fig. 5), and thus the two vertically drawn equilibria have similar free energies. Because these free energies are similar, the free energies associated with the two horizontally drawn equilibria must be the same (i.e. that PLCβ association to C3PO is unchanged in the presence of nucleotide). A lack of direct effect of PLCβ on nucleotide interaction is supported by our inability to detect interaction between PLCβ and nucleotides and the idea that PLCβ is not incorporating into the octamer.
Binding of PLCβ to C3PO is expected to have functional consequences that may underlie the basis for selectivity of PLCβ in reversal of certain siRNAs. We first compared the binding of two siRNAs, siRNA(GAPDH) and siRNA(Hsp90) to translin (8) and to inactive C3PO. Although we measure differences in binding and displacement of the two siRNA from both translin and C3PO, PLCβ has similar effects on both protein complexes. These differences, shown in Figs. 5 and 6, along with differences in their exposure to aqueous quenchers, suggest that siRNA sequence/stability allows for different molecular movements of C3PO that result in faster or slower catalytic rates. Our results lead to a simple model in which binding of PLCβ on external sites either between the TRAX subunits or on one of the subunits prevents the conformational movement needed for TRAX to carry out the faster rate of hydrolysis, which only occurs for certain specific RNA sequences/structures (Fig. 9). An important feature of this model is that RNA specificity lies entirely within C3PO, whose actions will only be affected by PLCβ for RNAs that are hydrolyzed through the more rapid kinetic pathway. A comprehensive study on the specificity and mechanism of C3PO is being carried out.
In this study, we have focused on the biophysical aspects of PLCβ's association with C3PO, but we have yet to address the physiological aspects of their association. We have found that PLCβ reverses both siRNA(GAPDH) and siRNA(LDH). Both these latter proteins not only play a critical role in cell metabolism but also incorporate into a complex required for histone H2B synthesis and cell cycle progression (8, 30, 31). The observation that PLCβ can reverse H2B down-regulation without affecting Hsp90 correlates with studies suggesting that PLCβ plays a prominent role in the cell cycle (3). The studies here suggest that genes whose levels are regulated by microRNAs with structures allowing rapid hydrolysis by C3PO are vulnerable to secondary regulation by cytosolic levels of PLCβ. Studies are underway to test this hypothesis.
Acknowledgments
We are grateful to Dr. Hong Zhang (University of Texas Southwestern at Dallas) for recombinant C3PO and to Dr. Runnels (Rutgers University) for HEK293 cells that can be induced to overproduce PLCβ1. We are also grateful to Prabhjot Grewal for experimental support and to Drs. Yuanjian Guo, Bonnie Calizo, and Urszula Golebiewska for helpful comments throughout this work.
This work was supported, in whole or in part, by National Institutes of Health Grant GM053132.
S. Scarlata, J. Wang, and L. Runnels, unpublished data.
- PLCβ
- phospholipase Cβ
- TRAX
- translin-associated factor; X
- eCFP
- enhanced cyan fluorescent protein
- eYFP
- enhanced YFP
- LDH
- lactate dehydrogenase
- FAM
- 6-carboxyfluorescein
- BHQ
- black hole quencher
- FCS
- fluorescence correlation spectroscopy
- PCH
- photon counting histogram
- ssDNA
- single-stranded DNA
- RISC
- RNA-induced silencing complex.
REFERENCES
- 1. Hepler J. R., Gilman A. G. (1992) G-proteins. Trends Biochem. Sci. 17, 383–387 [DOI] [PubMed] [Google Scholar]
- 2. Suh P. G., Park J. I., Manzoli L., Cocco L., Peak J. C., Katan M., Fukami K., Kataoka T., Yun S., Ryu S. H. (2008) Multiple roles of phosphoinositide-specific phospholipase C isozymes. BMB Rep. 41, 415–434 [DOI] [PubMed] [Google Scholar]
- 3. Rebecchi M. J., Pentyala S. N. (2000) Structure, function and control of phosphoinositide-specific phospholipase C. Physiol. Rev. 80, 1291–1335 [DOI] [PubMed] [Google Scholar]
- 4. Dowal L., Provitera P., Scarlata S. (2006) Stable association between Gαq and phospholipase Cβ1 in living cells. J. Biol. Chem. 281, 23999–24014 [DOI] [PubMed] [Google Scholar]
- 5. Aisiku O., Dowal L., Scarlata S. (2011) Protein kinase C phosphorylation of PLCβ1 regulates its cellular localization. Arch. Biochem. Biophys. 509, 186–190 [DOI] [PMC free article] [PubMed] [Google Scholar]
- 6. Filtz T. M., Grubb D. R., McLeod-Dryden T. J., Luo J., Woodcock E. A. (2009) Gq-initiated cardiomyocyte hypertrophy is mediated by phospholipase Cβ1b. FASEB J. 23, 3564–3570 [DOI] [PubMed] [Google Scholar]
- 7. Hughes T. E., Zhang H., Logothetis D. E., Berlot C. H. (2001) Visualization of a functional Gαq-green fluorescent protein fusion in living cells. J. Biol. Chem. 276, 4227–4235 [DOI] [PubMed] [Google Scholar]
- 8. Philip F., Guo Y., Aisiku O., Scarlata S. (2012) Phospholipase Cβ1 is linked to RNA interference of specific genes through translin-associated factor X. FASEB J. 26, 4903–4913 [DOI] [PMC free article] [PubMed] [Google Scholar]
- 9. Aisiku O. R., Runnels L. W., Scarlata S. (2010) Identification of a novel binding partner of phospholipase Cβ1: Translin-associated factor X. PLoS ONE 5, e15001. [DOI] [PMC free article] [PubMed] [Google Scholar]
- 10. Jaendling A., McFarlane R. J. (2010) Biological roles of translin and translin-associated factor-X: RNA metabolism comes to the fore. Biochem. J. 429, 225–234 [DOI] [PubMed] [Google Scholar]
- 11. Li Z., Wu Y., Baraban J. M. (2008) The Translin/Trax RNA binding complex: Clues to function in the nervous system. Biochim. Biophys. Acta 1779, 479–485 [DOI] [PMC free article] [PubMed] [Google Scholar]
- 12. Liu Y., Ye X., Jiang F., Liang C., Chen D., Peng J., Kinch L. N., Grishin N. V., Liu Q. (2009) C3PO, an endoribonuclease that promotes RNAi by facilitating RISC activation. Science 325, 750–753 [DOI] [PMC free article] [PubMed] [Google Scholar]
- 13. Tian Y., Simanshu D. K., Ascano M., Diaz-Avalos R., Park A. Y., Juranek S. A., Rice W. J., Yin Q., Robinson C. V., Tuschl T., Patel D. J. (2011) Multimeric assembly and biochemical characterization of the Trax-translin endonuclease complex. Nat. Struct. Mol. Biol. 18, 658–664 [DOI] [PMC free article] [PubMed] [Google Scholar]
- 14. Ye X., Huang N., Liu Y., Paroo Z., Huerta C., Li P., Chen S., Liu Q., Zhang H. (2011) Structure of C3PO and mechanism of human RISC activation. Nat. Struct. Mol. Biol. 18, 650–657 [DOI] [PMC free article] [PubMed] [Google Scholar]
- 15. Parizotto E. A., Lowe E. D., Parker J. S. (2013) Structural basis for duplex RNA recognition and cleavage by Archaeoglobus fulgidus C3PO. Nat. Struct. Mol. Biol. 20, 380–386 [DOI] [PMC free article] [PubMed] [Google Scholar]
- 16. Wu P.-H., Isaji M., Carthew R. W. (2013) Functionally diverse microRNA effector complexes are regulated by extracellular signaling. Mol. Cell 52, 113–123 [DOI] [PMC free article] [PubMed] [Google Scholar]
- 17. Runnels L. W., Scarlata S. (1999) Determination of the affinities between heterotrimeric G protein subunits and their phospholipase C-b effectors. Biochemistry 38, 1488–1496 [DOI] [PubMed] [Google Scholar]
- 18. Philip F., Scarlata S. (2006) Real time measurements of protein affinities on membrane surfaces by fluorescence spectroscopy. Sci. STKE 2006, 15–25 [DOI] [PubMed] [Google Scholar]
- 19. Wang J., Sengupta P., Guo Y., Golebiewska U., Scarlata S. (2009) Evidence for a second, high affinity Gβγ-binding site on Gαi1(GDP) subunits. J. Biol. Chem. 284, 16909–16913 [DOI] [PMC free article] [PubMed] [Google Scholar]
- 20. Guo Y., Golebiewska U., D'Amico S., Scarlata S. (2010) The small G protein Rac1 activates phospholipase Cδ1 through phospholipase Cβ2. J. Biol. Chem. 285, 24999–25008 [DOI] [PMC free article] [PubMed] [Google Scholar]
- 21. Royer C. A., Scarlata S. (2008) in Methods in Enzymology (Brand L., Johnson M., eds) pp. 79–106, Academic Press, Burlington, VT [Google Scholar]
- 22. Pérez-Cano L., Eliahoo E., Lasker K., Wolfson H. J., Glaser F., Manor H., Bernadó P., Fernández-Recio J. (2013) Conformational transitions in human translin enable nucleic acid binding. Nucleic Acids Res. 41, 9566–9966 [DOI] [PMC free article] [PubMed] [Google Scholar]
- 23. Digman M. A., Dalal R., Horwitz A. F., Gratton E. (2008) Mapping the number of molecules and brightness in the laser scanning microscope. Biophys. J. 94, 2320–2332 [DOI] [PMC free article] [PubMed] [Google Scholar]
- 24. Gupta G. D., Kumar V. (2012) Identification of nucleic acid-binding sites on translin-associated factor X (TRAX) protein. PLoS One 7, e33035. [DOI] [PMC free article] [PubMed] [Google Scholar]
- 25. Chennathukuzhi V., Stein J. M., Abel T., Donlon S., Yang S., Miller J. P., Allman D. M., Simmons R. A., Hecht N. B. (2003) Mice deficient for testis-brain RNA-binding protein exhibit a coordinate loss of TRAX, reduced fertility, altered gene expression in the brain, and behavioral changes. Mol. Cell. Biol. 23, 6419–6434 [DOI] [PMC free article] [PubMed] [Google Scholar]
- 26. Lyon A. M., Tesmer V. M., Dhamsania V. D., Thal D. M., Gutierrez J., Chowdhury S., Suddala K. C., Northup J. K., Tesmer J. J. (2011) An autoinhibitory helix in the C-terminal region of phospholipase C-β mediates Gαq activation. Nat. Struct. Mol. Biol. 18, 999–1005 [DOI] [PMC free article] [PubMed] [Google Scholar]
- 27. Lakowicz J. (1999) Principles of Fluorescence Spectroscopy, 2nd Ed., pp. 353–385, Plenum Publishing Corp., New York [Google Scholar]
- 28. Scarlata S. (2004) in Reviews in Fluorescence (Geddes C., Lakowicz J., eds) pp. 75–84, Plenum Publishing Corp., New York [Google Scholar]
- 29. Patterson G. H., Piston D. W., Barisas B. G. (2000) Forster distances between green fluorescent protein pairs. Anal. Biochem. 284, 438–440 [DOI] [PubMed] [Google Scholar]
- 30. Dai R.-P., Yu F.-X., Goh S.-R., Chng H.-W., Tan Y.-L., Fu J.-L., Zheng L., Luo Y. (2008) Histone 2B (H2B) expression is confined to a proper NAD+/NADH redox status. J. Biol. Chem. 283, 26894–26901 [DOI] [PubMed] [Google Scholar]
- 31. Zheng L., Roeder R. G., Luo Y. (2003) S phase activation of the histone H2B promoter by OCA-S, a coactivator complex that contains GAPDH as a key component. Cell 114, 255–266 [DOI] [PubMed] [Google Scholar]


