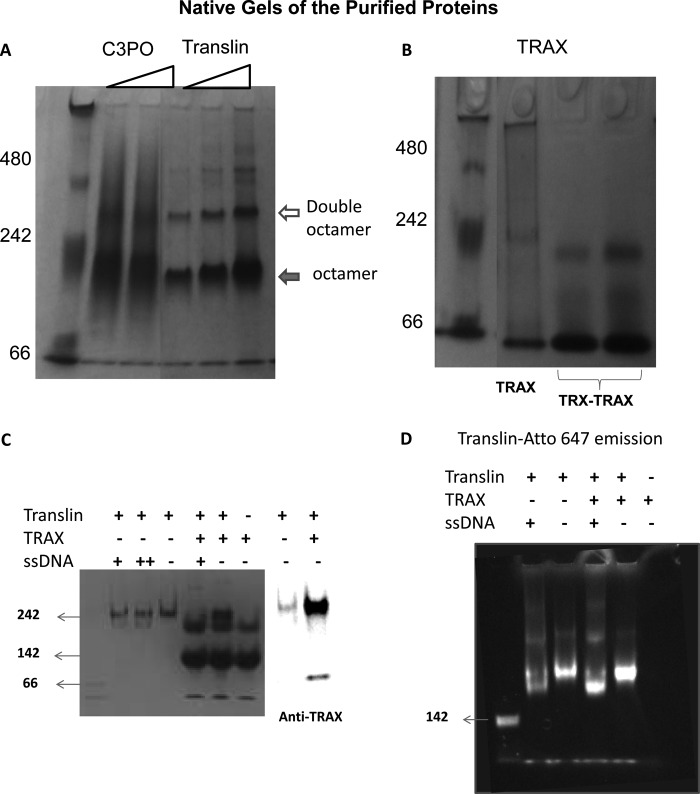
FIGURE 2.
Aggregation states of the purified proteins. A, 5% Coomassie-stained native gel, pH 8, is shown with increasing concentrations of C3PO (1 and 2 μm, 226 kDa) and translin (0.75 μm, 1 μm, 26 kDa) from left to right where the filled arrow refers to the octamer band, and the open arrow refers to a double octamer. B, similar native gel with 0.5 μm TRAX (35 kDa) and 3 μm of TRX-TRAX (2 right lanes), where the TRX tag is used for purification, is shown. C, 5% native gel is shown with 0.5 μm translin, 1 μm TRAX, and 0.5 μm ssDNA (+) or 1.5 μm ssDNA (++) as indicated. The TRAX band of the TRX/TRAX mixture on the native gel was identified by Western blotting on a similar gel probed with an antibody for TRAX (BD Biosciences), where a small amount of staining is noted for translin. D, translin labeled with Atto-647 at its N terminus is shown on a native gel (0.5 μm translin, 1 μm TRAX, and 0.5 μm ssDNA). The 1st lanes for both C and D (unlabeled) are molecular mass markers corresponding to 142 kDa.

