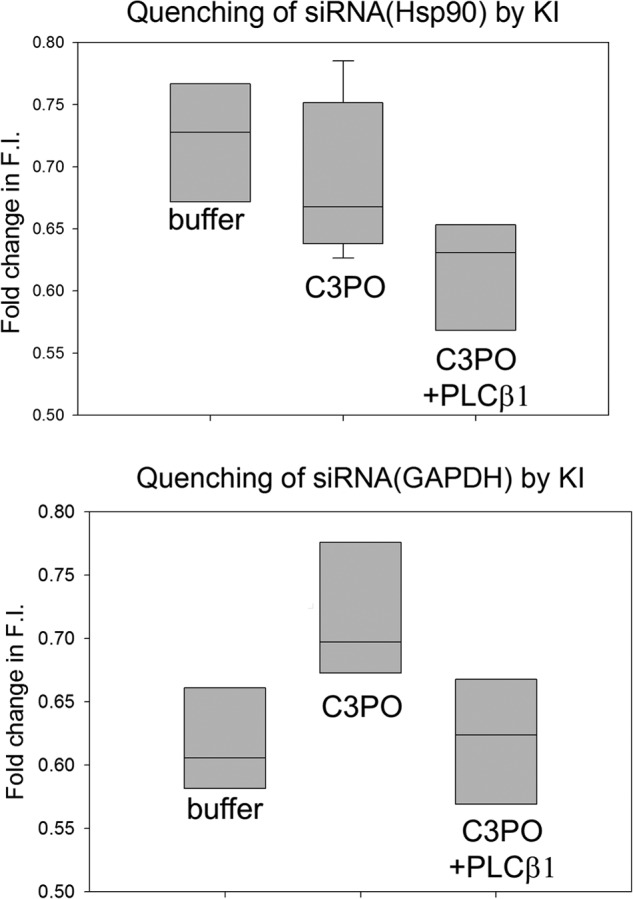
FIGURE 7.

Quenching studies suggest differences in siRNA structure. Shown is the maximum quenching by KI of solutions containing 2 nm FAM-siRNA(Hsp90) (top panel) or FAM-siRNA(GAPDH) (bottom panel) (n = 6), either free or bound to 200 nm C3PO (n = 9) or 200 nm C3PO/500 nm PLCβ1 (n = 9). Nucleotides were incubated with C3PO or C3PO-PLCβ1 for 10 min before adding to the cuvettes. The data here represent the end points of the titration curves taken at 800 mm KI where the maximum value for all samples was reached within 600 mm KI. Although quenching of the protein-bound complexes is not significantly different, quenching of the free siRNAs differ (p = 0.005). F.I., fluorescence intensity.
