
FIGURE 8.
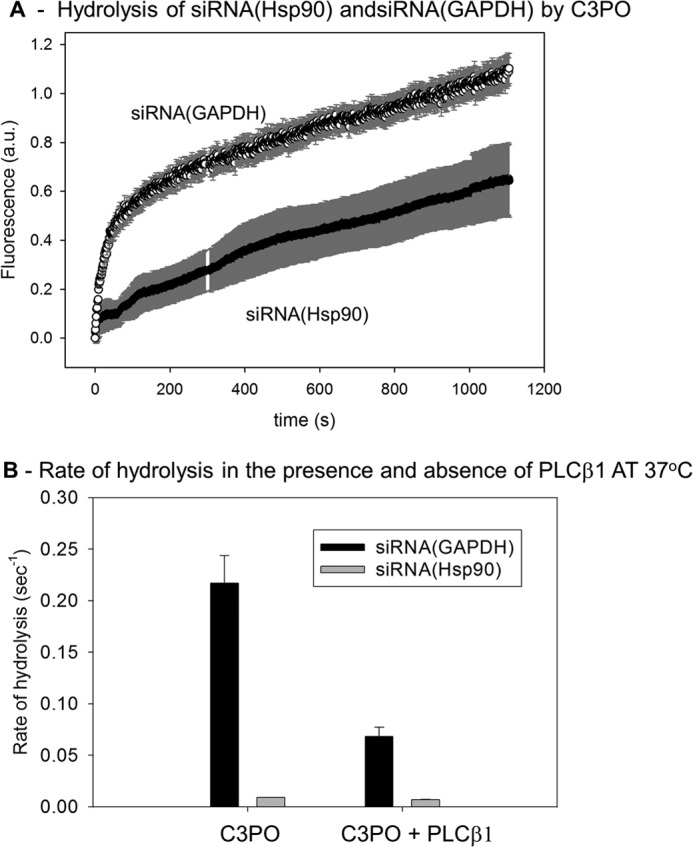
Rates of hydrolysis by C3PO and the impact of bound PLCβ1 differ for different siRNAs. A, curves showing the real time rates of hydrolysis of 2 nm siRNA(GADPH) and 2 nm siRNA(Hsp90) by 200 nm C3PO followed by dequenching of the 5′-terminal FAM probe from the 3′ BHQ. This study was done at 25 °C and is an average of three trials. a.u., arbitrary units. B, compilation of the rates of hydrolysis of 2 nm siRNAs by 200 nm C3PO in the absence or presence of 500 nm PLCβ mixture. C3PO was incubated with PLCβ1 for 10 min before adding siRNA.