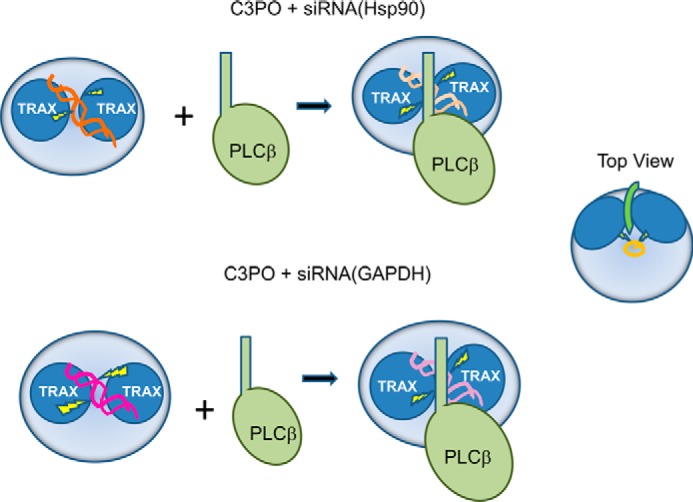
FIGURE 9.

Model of differences between C3PO hydrolysis of siRNAs in the presence of PLCβ. As shown in the leftmost schematic, the two subunits of TRAX (dark blue circles), residing in the C3PO octamer (large light blue circles) bind siRNA(GAPDH) (pink helices) slightly differently than siRNA(Hsp90) (dark orange helices) resulting in more efficient and rapid hydrolytic interactions (yellow lightning bolts). In the presence of bound PLCβ (light green), the interactions with siRNA(GAPDH) (light pink helices) become similar to siRNA(Hsp90) (light orange helices) allowing for comparable hydrolytic rates. The schematic to the far left is a top view on the complex showing only the C-terminal tail of PLCβ. In this model, the C terminus lies on top of the octamer and in between the TRAX subunits. The oligonucleotide is depicted in orange.
