FIGURE 4.
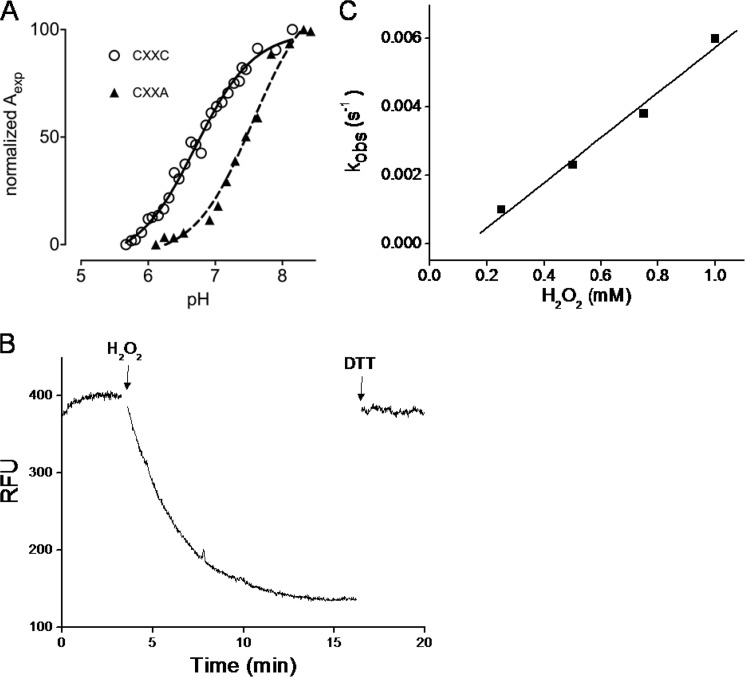
MtMrx1 thiol pKa determinations and kinetics of oxidation by H2O2. A, pKa titration curves for wild type (circles) (15) and the CXXA mutant (triangles). The specific absorption of the thiolate ion at 240 nm as a function of the pH is shown. Aexp is determined as described (31). Data were fitted with the Henderson-Hasselbach equation. B, time-dependent decrease in the total intrinsic fluorescence intensity (λex = 295 nm, λem = 335 nm) of MtMrx1wt (10 μm) upon oxidation by H2O2 in 100 mm sodium phosphate buffer plus 0.1 mm DTPA, at pH 7.4 and room temperature. The first arrow indicates the addition of excess H2O2 (1.5 mm) and the second, the addition of DTT (1.5 mm). C, effect of H2O2 concentration on the observed rate constants of wtMtMrx1 intrinsic fluorescence change.

