FIGURE 6.
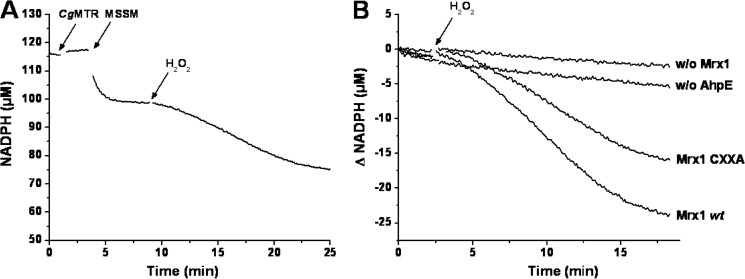
NADPH consumption during MtAhpE-mediated H2O2 reduction. A, time-dependent consumption of NADPH (100 μm) in a coupled assay containing 20 μm MtAhpE, 5 μm MtMrx1wt, 0.13 μm CgMR, 30 μm MSSM, and 20 μm H2O2 in 50 mm HEPES, 0.5 mm EDTA, pH 7.8 at 25 °C. The arrows indicate the addition of the last three mentioned components to the mixture. B, NADPH consumption upon addition of H2O2 (arrow) in mixtures as in A (Mrx1 wt); with CXXA instead of wt MtMrx1 (Mrx1 CXXA); in the absence of MtMrx1 (w/o Mrx1) or in the absence of MtAhpE (w/o AhpE). Representative traces that were repeated in independent days with the same results are shown.

