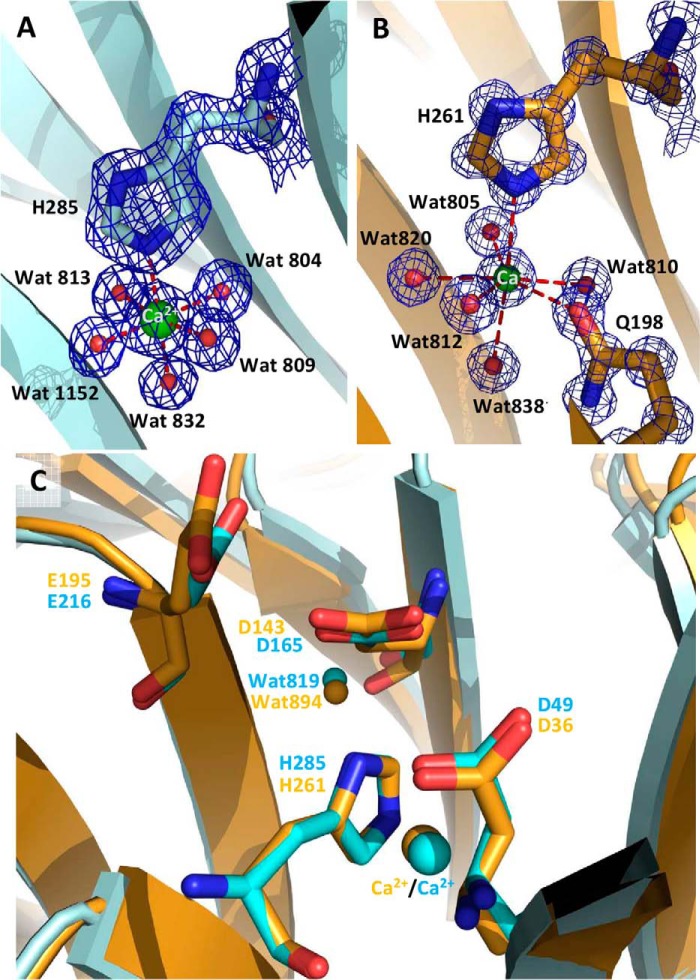
FIGURE 3.
The active site pocket of UmAbf62A and PaAbf62A. A and B, calcium ion coordination for PaAbf62A and UmAbf62A, respectively. C, superimposition of PaAbf62A and UmAbf62A active sites. PaAbf62A is represented in cyan and UmAbf62A in gold. The residues shown in the stick calcium ions are shown in spheres. Electron density map was contoured at 2σ. This figure and other figure have been drawn with PyMOL (Delano Scientific, pymol.sourceforge.net/).

