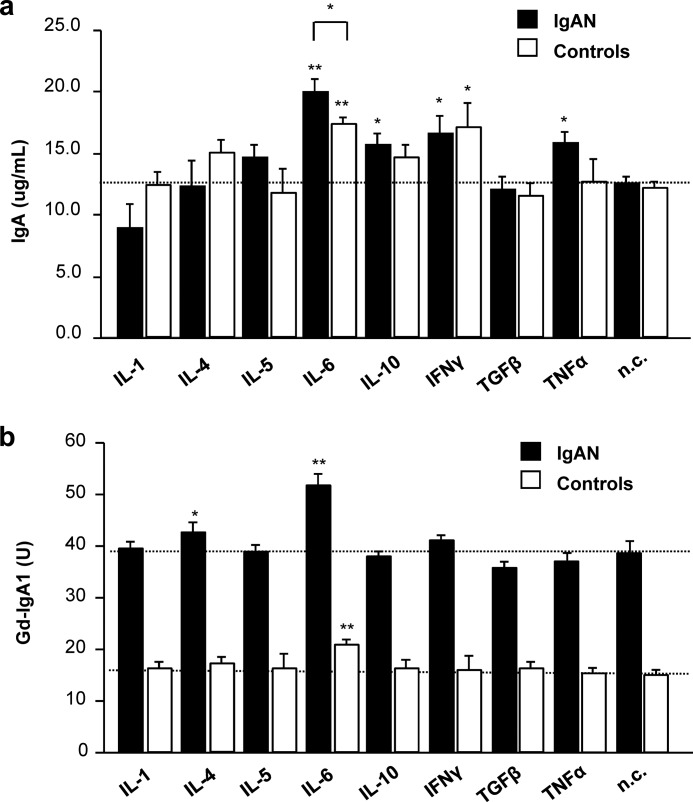
FIGURE 1.
Influence of cytokines on IgA1 production and O-glycosylation by IgA1-secreting cells. Cell lines from three IgAN patients (IgAN; black columns) and three healthy controls (white columns, controls) were used. a, IgA production. The horizontal dashed line marks the mean IgA concentration for non-stimulated cells from IgAN patients (n.c.). b, production of galactose-deficient IgA1 (Gd-IgA1). Horizontal dashed lines mark the mean Gd-IgA1 concentrations from non-stimulated cells (n.c.) from IgAN patients (upper line) and healthy controls (lower line). U, units. 100 units was defined as HAA binding to 50 ng of standard Gd-IgA1 (Ale) myeloma protein. Mean values ± S.D. from two independent experiments are shown. n.c., negative control (i.e. not stimulated with any cytokine); *, p < 0.05; **, p < 0.01 for comparisons with the negative control.

