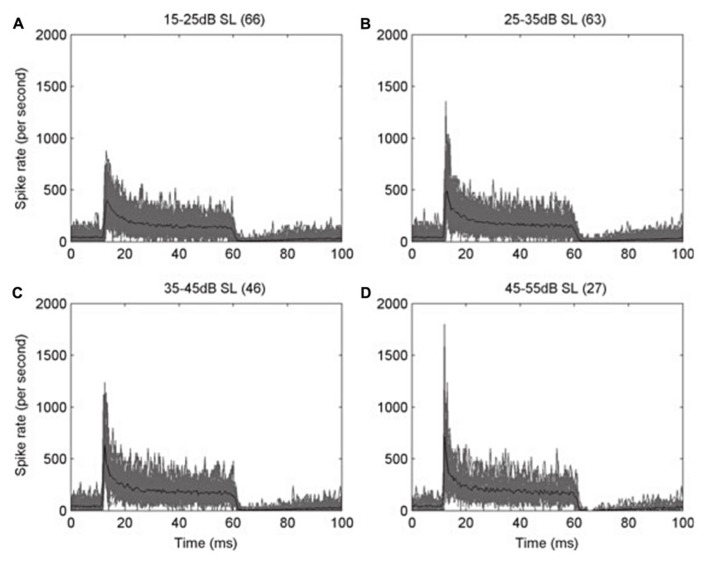
FIGURE 1.
Peri-stimulus time histograms (PSTH) of the response of auditory nerve fibers of the ferret. The action potentials of auditory nerve fibers with high characteristic frequency (CF > 1.5 kHz) were recorded during the presentation of a 50 ms pure tone at the CF of each fiber, and then the spike times from all the fibers were pooled. (A–D) Each panel shows the overplotted response (gray) from the number of fibers in parentheses, at different levels above their threshold, as indicated on the top of each panel. The mean values are plotted in black. Note how the initially high response rate decreases rapidly to a steady state, in an example of spike-frequency adaptation. Bin width is 0.5 ms. Reproduced from Sumner and Palmer (2012).

