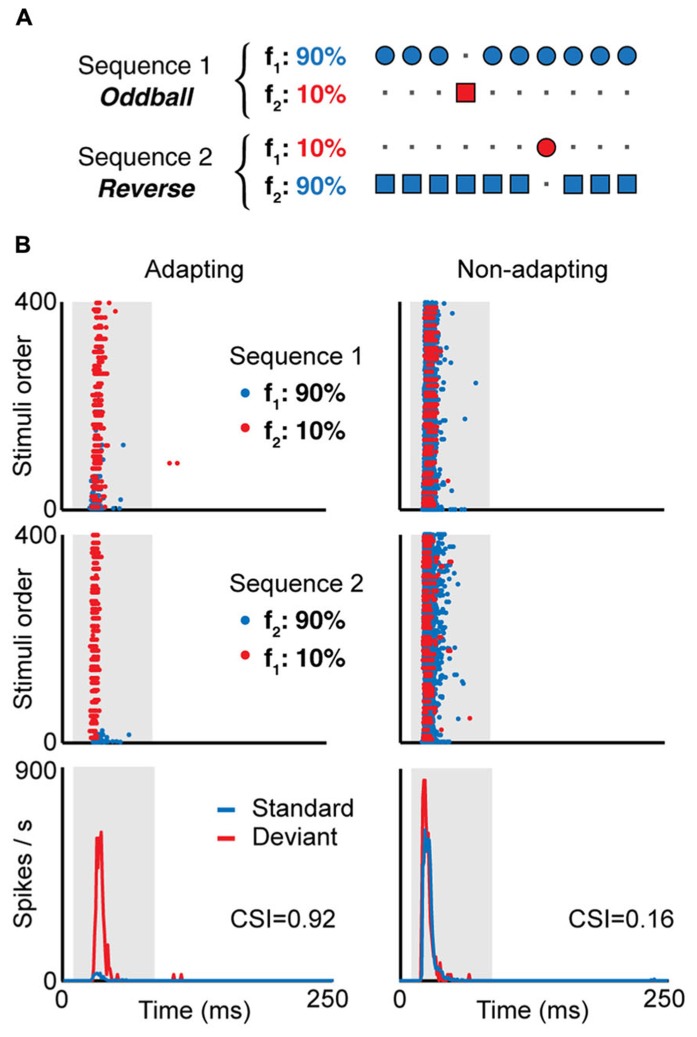
FIGURE 2.
(A) In the oddball paradigm, a low probability stimulus (f2, red, “deviant”) is embedded in a train of high probability stimuli (f1, blue, “standard”). To compensate the responses to the different physical stimuli f1 and f2, a second sequence is presented where the probability of each stimulus is reversed. Examples of the responses of two neurons recorded using this paradigm is shown in (B), an IC neuron showing SSA (adapting, left) and another not showing SSA (non-adapting, right). Here, f1 and f2 are pure tones of different frequencies, and the frequency difference is the same for both neurons. The top and middle panels in (B) show the dot raster in response to sequence 1 (top) and sequence 2 (middle), where the blue dots represent spikes in response to the standard and the red dots the response to the deviant. In the adapting neuron, the response to the standard stimulus decays after the first presentations, while the response to the deviant stimulus remains constant, as a typical example of stimulus-specific adaptation. The bottom panels show the PSTH for the responses to the standard and deviant stimuli, combining the spikes for both stimuli at the same probability. The value of the common SSA index (CSI) is shown for each neuron; CSI values close to one indicate strong SSA while values close to zero indicate weak SSA. Adapted from Duque et al. (2012).

