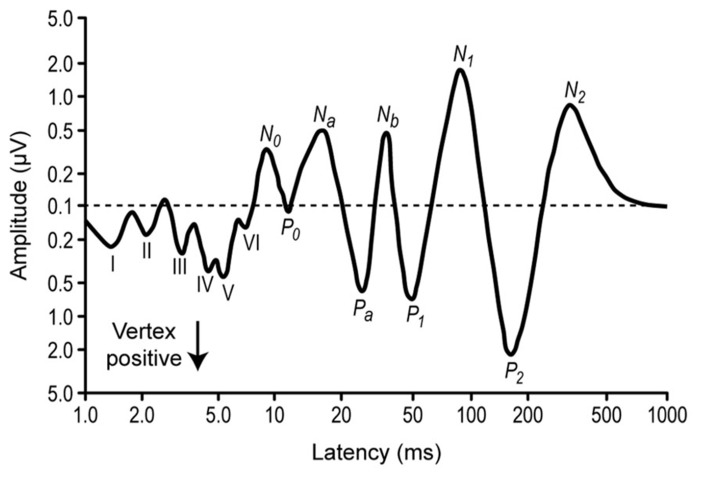
FIGURE 4.
Diagrammatic representation of the auditory evoked potential components. Average from several subjects. The stimuli were clicks presented monaurally, and the EEG was recorded from a electrode in the vertex position and a reference at the mastoid. The components from the first 10 ms (I–VI) correspond to the auditory brainstem responses (ABR), around 20–50 ms correspond to the middle latency responses, and 150–250 ms correspond to the activation of the frontal cortex. Note the logarithmic scales. Redrawn from Picton et al. (1974).

