Figure 4.

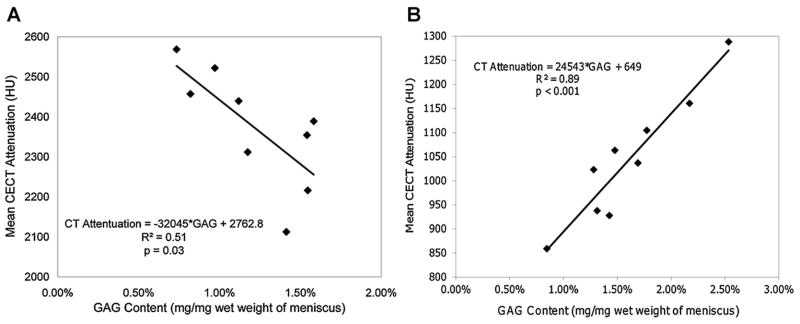
Correlations between CECT attenuation (HU) and GAG content (mg/mg) of menisci samples after immersion for 95 h in (A) Ioxaglate (n = 9) and (B) the CA4+ contrast agent (n = 9).

Correlations between CECT attenuation (HU) and GAG content (mg/mg) of menisci samples after immersion for 95 h in (A) Ioxaglate (n = 9) and (B) the CA4+ contrast agent (n = 9).